

Founders raise their first money on Simple Agreements for Future Equity (SAFEs).
Two pages. A signature. The wire lands by Friday.
Then another one. Then a bridge.
The cap table never moves. Founders 90%, option pool 10%, exactly as it looked the day the company was incorporated.
Eighteen months later, the seed lead sends the pro forma.
The founders own 54.9%.
A SAFE doesn’t remove dilution. It hides it until the day it all arrives at once.
So we modelled it. Three SAFEs, one seed round, one Series A, every point of equity traced.
Want to get in front of 250k+ founders and investors?
For sponsorship opportunities across The Founders Corner newsletter and LinkedIn (160k followers), email: founderscornermedia@gmail.com
The Stack Nobody Adds Up
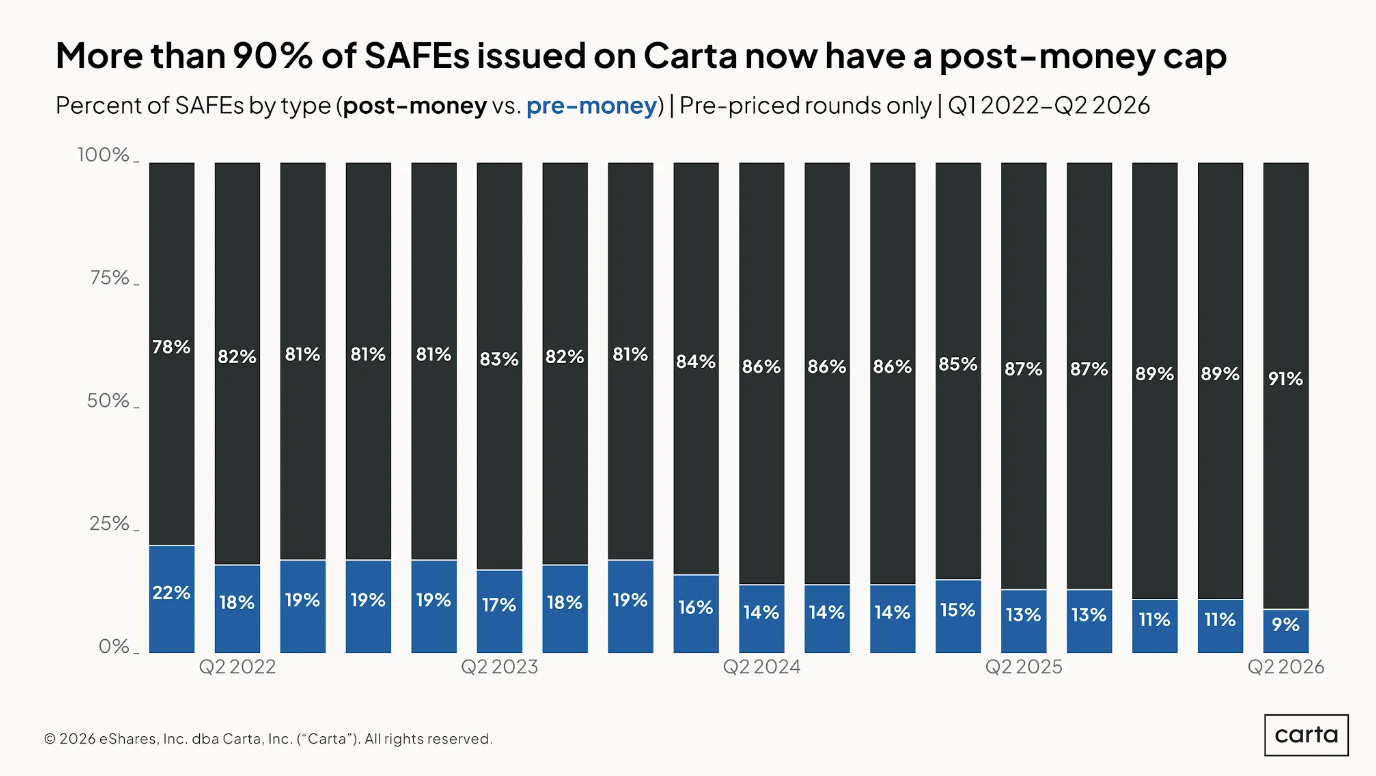
Our founders raise the way almost everyone now does. In Q2 2026, 93% of pre-seed rounds on Carta were SAFEs, and 91% of those SAFEs were post-money.
Three cheques over sixteen months:
SAFE 1. $500k from angels at an $8m post-money cap. 6.25%.
SAFE 2. $1.5m from a pre-seed fund at a $15m cap, with a 20% discount. 10%.
SAFE 3. $1m bridge from insiders at a $20m cap. 5%.
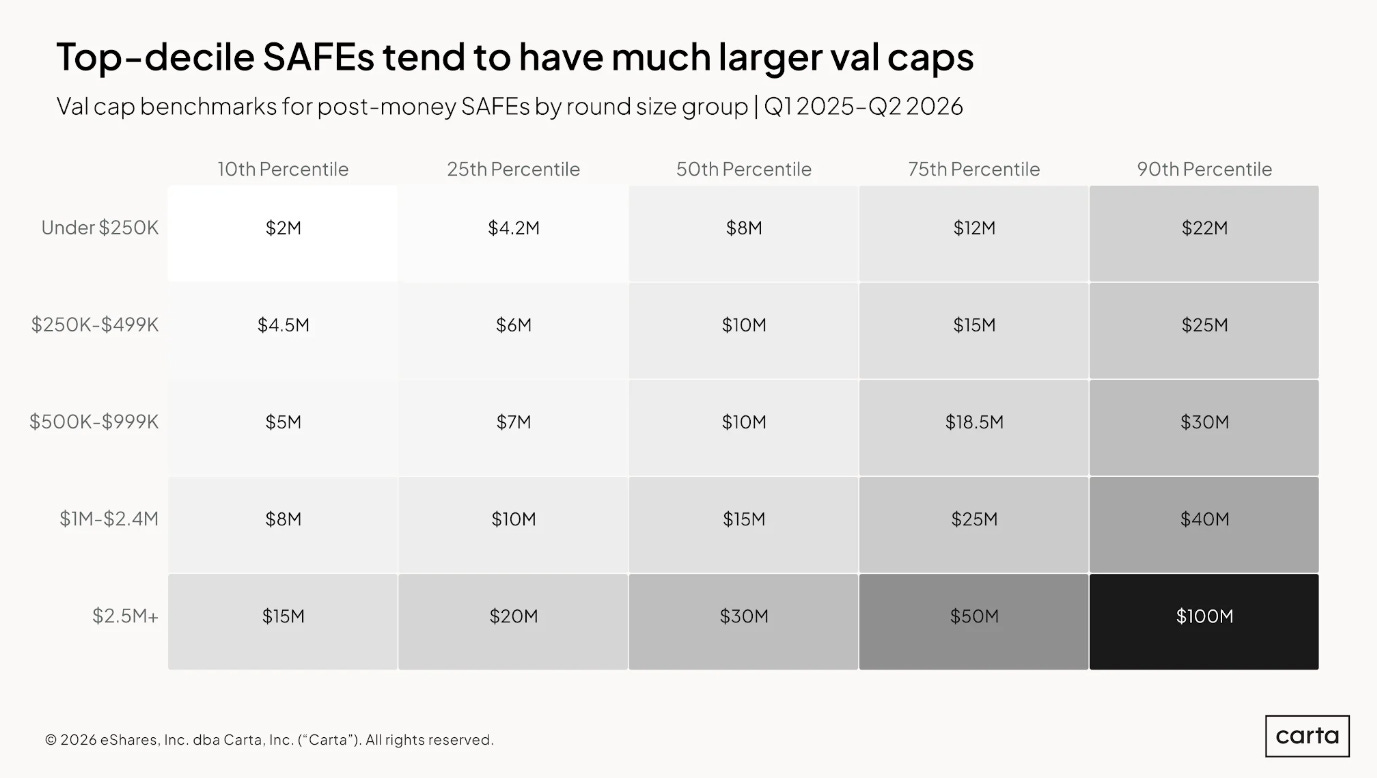
None of these are aggressive terms. A $15m cap is exactly Carta’s median for SAFEs of $1m–$2.4m.
The maths on a post-money SAFE is one line:
Stake sold = amount ÷ post-money cap
Add them up. 21.25% of the company, sold for $3m, at a blended $14.1m valuation.
The cap table shows none of it. A SAFE isn’t a share until a priced round converts it, so the issued cap table still reads 90%. As-converted, the founders already own 70.9%.
Post-money SAFEs also add rather than compound. Each new SAFE dilutes the founders and the pool. It never dilutes the earlier SAFE holders.
To be fair to the instrument, this is the post-money SAFE working as designed. When Y Combinator replaced its original SAFE in 2018, the stated point was that founders could work out exactly how much of the company they had sold the moment each one was signed.
The document is honest. Nobody adds the column.
Seed Day: 35 Points in One Closing
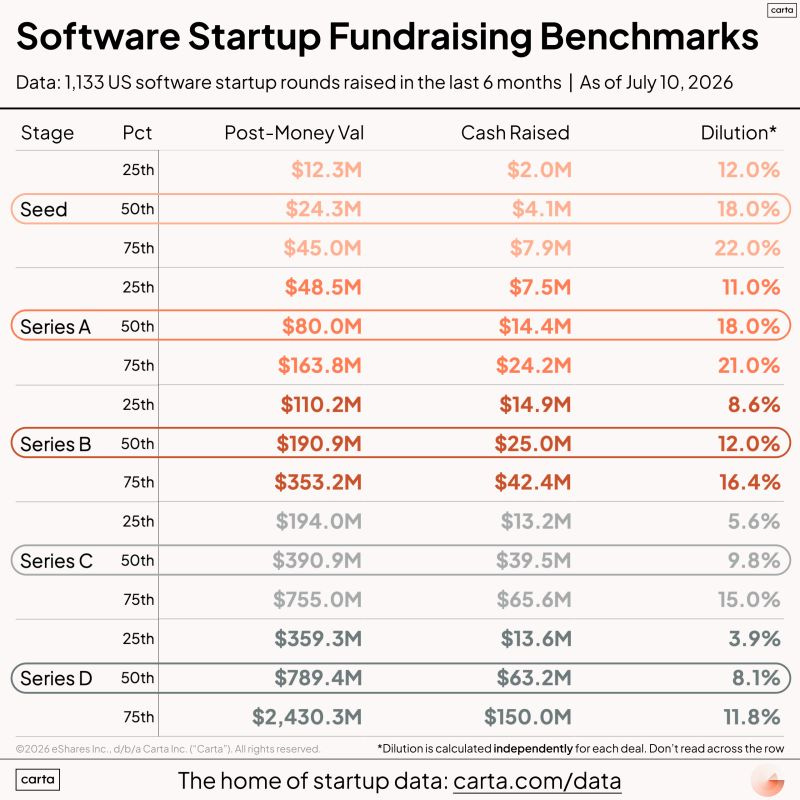
The seed round lands at $4m on a $20m pre-money. That’s $24m post, almost exactly the market middle.
The lead asks for the option pool to be 12% after the round, created in the pre-money.
The founders run the sum they have always run:
Expected stake = 90% × (1 − $4m ÷ $24m) = 75%
They get 54.9%.
SAFE conversion. −19.1 points.
Seed investors’ new shares. −11.8 points.
Option pool top-up. −4.2 points.
The SAFE stack takes more from the founders than the seed round does.
The pool top-up stings for the same reason. Because it sits in the pre-money, founders and SAFE holders fund it. The new investor doesn’t.
The 20.1-point gap wasn’t lost on seed day. It was sold months earlier, two pages at a time.
Carta’s Peter Walker puts it in one line: SAFEs do not really minimise dilution, they “simply delay it.”
The Cap Only Moves One Way
Most founders assume a hot seed round makes their old SAFEs cheap.
It can’t. A capped post-money SAFE owns amount ÷ cap however high the round prices.
Run the same stack through different seed rounds, with the $4m held constant:
$24m post. Founders 54.9%. SAFE holders 16.5%, worth $3.9m.
$48m post. Founders 61.3%. SAFE holders 18.4%, worth $8.8m.
$72m post. Founders 63.4%. SAFE holders 19.0%, worth $13.7m.
Tripling the seed price buys the founders 8.5 points. The SAFE holders’ share actually rises, because their stake is fixed before the new money arrives, and a pricier round means a smaller seed slice diluting them.
Now run it the other way. At $16m post, the caps stop binding and the SAFEs convert at the discount or the round price. Founders fall to 40.8%.
The cap protects the investor on the upside. Nothing protects the founder on the downside.
That is a fair trade. Those investors wired money with no price and a strong chance of losing it. And at $72m the founders’ own stake is worth $45.7m, against $13.2m at $24m. Nobody loses in the good case.
The point is to price it knowingly. Which means knowing where your cap sits before you sign.
What the Data Says About the Stack
Carta’s latest numbers show the stack getting bigger, not smaller.
In the first half of 2026, 94% of post-money SAFEs carried a valuation cap. 73% had a cap and nothing else. 21% had both a cap and a discount, down from 40% in 2021.
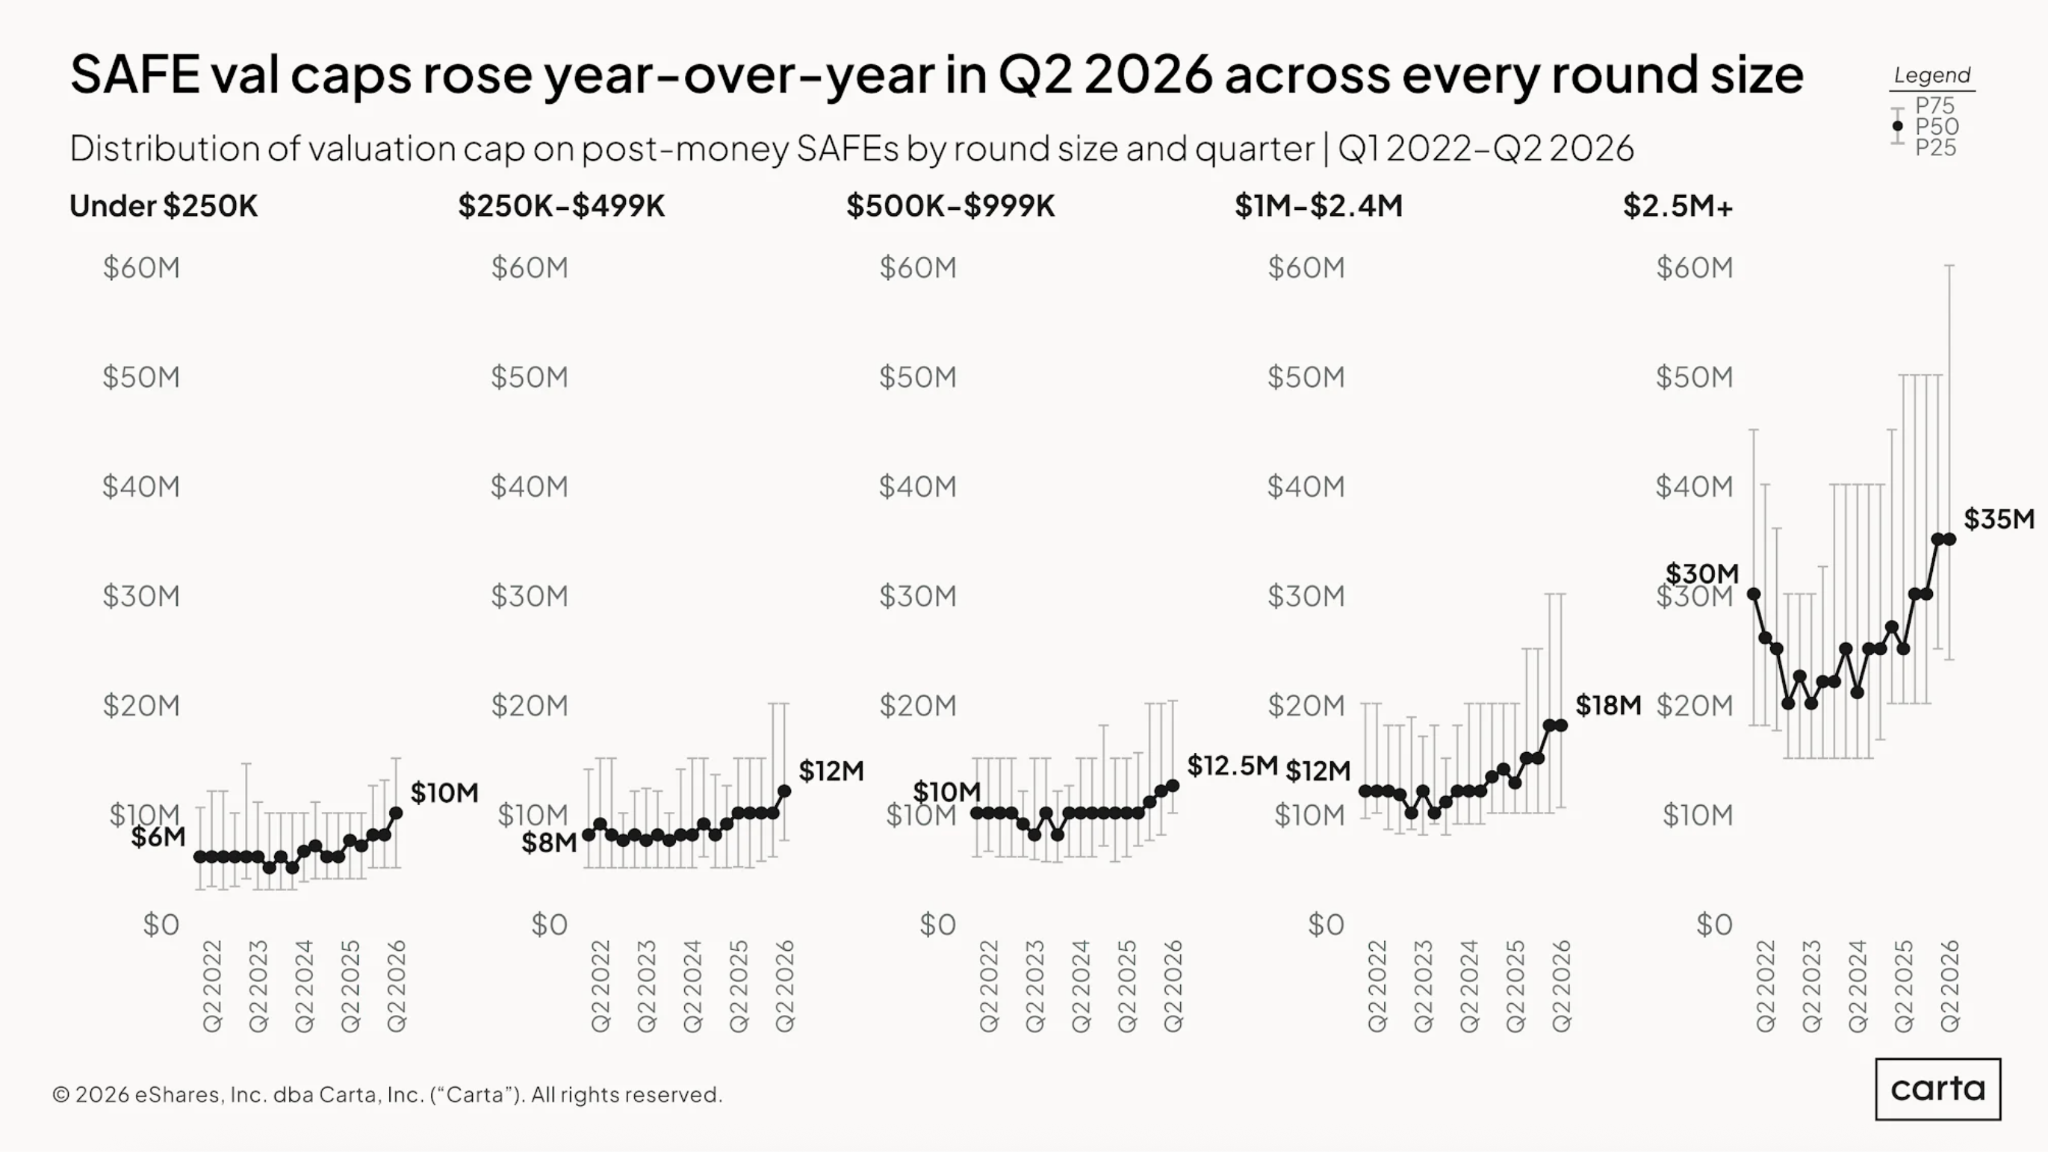
On SAFEs above $2.5m, the median cap reached $35m in Q2 2026, up 40% in a year. The average pre-seed instrument hit a record $276,000, and the larger pre-seed deals typically stack ten or more instruments together.
Higher caps sound like good news for founders. They are, per cheque. But bigger caps invite bigger cheques, and the stack is measured in percentage sold, not in cap.
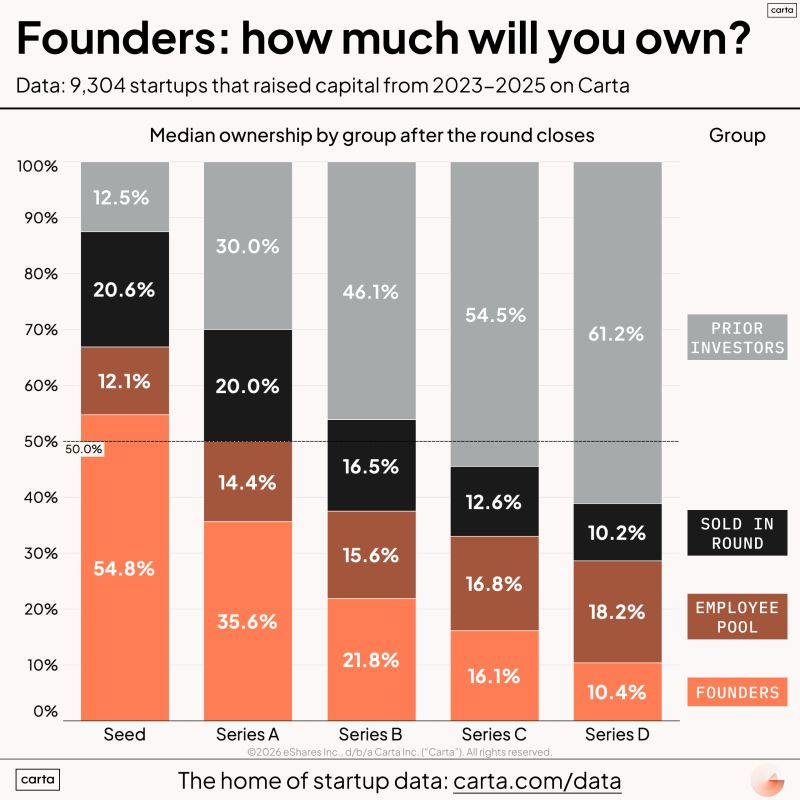
Then look at where founders end up. Back to that first chart: 54.8% after seed, 35.6% after Series A. Our three-SAFE founders land at 54.9% after seed, within a rounding error of the median.
That doesn’t prove the median founder carries a stack like ours. It does show this outcome is ordinary, not a horror story.
Our Most-Read Articles Right Now
🔥 The Document That Is Killing Your Series A (And You Have Already Signed It) The cap table problems to fix in the twelve months before you raise.
🔥 We Priced 255 Startup Accelerators. The Rankings Fell Apart. The implied valuation inside every accelerator SAFE, YC included.
📋 The Most Dangerous Document a Founder Will Ever Sign The term sheet clauses that matter more than valuation.
📋 What a Cap Table Actually Is (And Why Most Founders Misread It) What your ownership tells investors before you say a word.
The Clause That Reprices Your Biggest SAFE
One instrument deserves its own warning: the uncapped MFN (Most Favored Nation) SAFE.
Y Combinator’s standard deal is $125k for a fixed 7%, plus $375k on an uncapped SAFE with “most favoured nation” terms. That $375k takes the lowest cap on any SAFE issued between the start of the batch and the next priced round.
YC’s own example: raise your next SAFEs at a $15m cap and the $375k converts to 2.5%.
Now let a friendly angel in at $6m after the batch starts. The MFN SAFE converts at $6m too. 6.25%.
One small cheque just repriced the largest SAFE on the cap table.
YC publishes all of this openly, and the deal is identical for every company. It’s a reason to keep caps consistent, not a reason to avoid YC.
Series A: Where the Stack Becomes Diligence
Take our founders into a $15m Series A on a $65m pre-money. That’s 18.75% new money, in line with Carta’s 18% median Series A dilution. The pool tops up to 15%.
Founders finish at 41.3%, comfortably above the 35.6% median.
A disciplined stack is the reason. Three SAFEs at rising caps converts cleanly. A pile of side letters, mismatched caps and an MFN that reset itself does not, and Series A investors read the stack before they read the deck.
What Each Side Should Do With This
Founders. Keep an as-converted column next to the cap table and update it the day each SAFE is signed. Set a stack budget before the first cheque. At a 25% budget, our founders have $0.94m of room left on a $25m cap.
Pre-seed investors. Post-money terms protect your percentage. Tell founders the running total anyway. A founder who discovers it at seed is a founder who renegotiates everything else.
Seed leads. Model the conversion before issuing the term sheet. A pool top-up in the pre-money comes out of the SAFE holders as well as the founders, and some of them will notice.
“Every SAFE is a slice of the company you have already sold. The cap table just hasn’t been told yet.”
The Bottom Line
Founders read the issued cap table, which doesn’t show SAFEs.
They price the seed round and forget the stack it converts.
They expect a hot round to shrink old SAFEs. Capped SAFEs don’t shrink.
They let one cheap cheque reprice an MFN they forgot they had.
The fix is one formula, run every time: stake sold = amount ÷ cap. Add every one. Then apply the seed and the pool to what’s left.
Run it before the next SAFE, not after the pro forma.
The file is waiting below.
The SAFE Dilution Model: 8 Tabs, 432 Live Formulas
Exactly what you’re downloading:
Dashboard. 12 headline tiles, including founders after seed and Series A, the hidden gap, blended SAFE valuation and SAFE stack value, plus the founder equity waterfall and post-seed ownership pie
Inputs. Founders and pool, a six-SAFE register (amount, post-money cap, discount, MFN and MFN window), the seed round, the Series A, six valuation scenarios and your stack budget
SAFE Conversion. Every SAFE converted on cap or discount, whichever gives the investor more shares, with implied conversion valuation, value at the seed price and multiple on cost
Pro Forma Cap Table. Ownership before conversion, as-converted, after seed and after Series A, with pie charts and a comparison against Carta’s medians
Valuation Scenarios. The same stack converted into six seed rounds side by side, with ownership and value charts
Stacking Tracker. What each SAFE does to the founders the day it’s signed, and the most you can raise on the next cap within budget
Market Benchmarks. 16 published data points from Carta and Y Combinator, each linked to source
Enter your SAFEs in the order you signed them, set the seed you expect, and read the number your cap table isn’t showing you.
Paid subscribers also get:
60+ additional tools across every stage of fundraising and company building: investor research, pitch deck screening, meeting prep, term sheet analysis, financial models, and the full investor database library.
Want it?
Download the model below.