
What a Cap Table Actually Is (And Why Most Founders Misread It)
How ownership, dilution, and preferences quietly shape fundraising and exits

Most founders think they understand their cap table.
They know the percentages.
They know what they “gave up.”
They know who’s on it.
But that surface level view misses what institutional investors actually read.
Early on, a cap table feels like routine admin, something you update after a SAFE converts or a new hire signs. It’s harmless, because nothing truly hinges on it yet.
Once you enter Series A or B conversations, everything hinges on it.
Investors treat the cap table as a diagnostic. It shows how thoughtfully equity has been managed, whether the founders are still meaningfully incentivised, how much dilution the company can absorb, and whether future rounds or exits will create value or quietly destroy it.
A cap table reveals discipline, judgement, leverage, and long term viability in a way pitch decks never can.
What follows breaks down how ownership evolves after seed, where founders unintentionally lose ground, how option pools and preferred share structures reshape outcomes, and how simple venture maths exposes the mechanics that determine whether a company remains investable as it scales.

Brought to you by Lindy — The AI That Actually Gets Work Done
Most AI tools give you words.
Lindy gives you outcomes.
It creates AI teammates that run full workflows across email, calendar, CRM, Slack, and internal systems. You define the process once. Lindy executes it every time through scheduling, follow ups, updates, and the work that usually slips.
This is not assistive AI.
It is operational automation with rules, triggers, and human review where it matters.
Lindy also includes prebuilt agents so teams start from proven workflows instead of blank pages.
For founders and operators who want scalable output without adding another hire.

Table of Contents
What Your Cap Table Is Really Telling Investors
Issued Shares vs. Fully Diluted Shares
Series A: The First Major Cap Table Stress Test
The Option Pool Trap: How Investor Mechanics Really Work
How Sophisticated Founders Push Back
Series B: When Ownership Stops Being The Point
Preferred Shares: The Clause That Changes Everything
The Same Exit, Two Very Different Outcomes
Exit Waterfalls: What Founders Really Take Home
The Story Your Cap Table Tells Without You Saying a Word
Bonus: The Full Cap Table Model Built for Real Rounds
1. What Your Cap Table Is Really Telling Investors
A cap table records who owns your company, across common shares, preferred shares, and anything that converts into equity such as SAFEs or notes.

Most founders think in percentages early on. Who owns what. Who sits where. That framing stops working once preferred shares enter the picture.
Preferred shares add rights that sit above common. Liquidation preferences, participation rights, conversion rules, and control terms all shape who gets paid first and how upside is shared when the outcome is good but not spectacular.
After seed, investors read the cap table very differently. They are no longer checking history. They are assessing judgement. The preferred structure shows whether early rounds were negotiated cleanly, whether protections have stacked sensibly, and whether the company can support another layer of capital without damaging incentives.
2. Issued Shares vs Fully Diluted Shares
This is where many founders get tripped up.
Issued shares are what exist today.
Founder shares. Investor shares that have already been issued. Options that have already been exercised.
Fully diluted shares assume that everything that can become a share eventually will.
That includes:
unexercised employee options
the remaining option pool
SAFEs and convertible notes converting
preferred shares converting into common

Investors always think in fully diluted terms. Founders often do not.
This is why founders are surprised when ownership “shrinks” without anything obvious happening. Nothing new was taken away. The denominator simply expanded.
When an investor says they want 20% ownership, they mean 20% of the fully diluted company, not 20% of what exists today. That distinction underpins option pool negotiations, SAFE conversions, and post-money ownership.
If you do not anchor on fully diluted shares, you will consistently underestimate dilution and overestimate control.
This is also why investors insist on fully diluted cap tables. They are not being pedantic. They are trying to see the company as it will exist, not as it exists for the next few weeks.
Once this distinction clicks, most cap table mechanics start to make sense.
3. Series A: The First Major Cap Table Stress Test

The jump from Seed to Series A is where your cap table undergoes its first real exam. Up to this point, you have been in a founder friendly zone. Post Seed investors may have overlooked messy documentation, inconsistent SAFE terms, or lopsided early equity grants. Institutional VCs operate differently. They will read your cap table line by line, reconstruct the past, and model your future.
Three issues matter immediately.
Clean Conversion of SAFEs and Notes
If ownership is not visible on a fully diluted basis, investors cannot model outcomes. Multiple notes with different caps introduce uncertainty, and uncertainty slows deals.
Dead Equity Reduction
Meaningful ownership held by inactive co founders, advisors, or early employees compresses incentives and complicates future rounds. Investors expect this to be addressed before closing.
Founder Incentives Must Remain Intact
If founders are fully vested too early, investors may request re vesting. This is alignment, not punishment. Preferred shares protect downside for investors. Vesting protects upside incentives for founders.
Only after these issues are handled does the real negotiation begin.
4. The Option Pool Trap: How Investor Mechanics Really Work
The option pool is where founders often lose more equity than they realise. Most institutional investors will request a pool expansion pre money.
That single word, pre, determines who pays the dilution bill.
Start with:
Founders own 10,000,000 common shares
Investor wants 20% ownership post money via preferred shares
Founders must therefore own 80% post round.
Total post round shares = 10,000,000 ÷ 0.8 = 12,500,000
Investor receives 2,500,000 preferred shares

Now add a 10% pool pre money.
New shares are issued before the investor enters. Founders absorb that dilution first. The investor then takes 20% of the larger total.
On paper it still looks like a 20% round.
In reality founders often give up closer to 27% to 30%.
That gap compounds.
5. How Sophisticated Founders Push Back
Prepared founders do not argue about dilution in the abstract.
They bring a hiring plan.
A clear view of roles, timing, and realistic equity ranges reframes the conversation from founder protection to capital efficiency. Investors respond to numbers, not emotion.

If the existing pool already covers expected hires, expansion becomes unnecessary.
6. Series B: When Ownership Stops Being The Point
By Series B, investors are underwriting returns, not potential.
They examine:
how much equity has been spent to reach current traction
whether founder incentives still hold after prior rounds
whether future dilution will break hiring or governance
whether the preferred stack supports aligned outcomes
Equity is capital.
Using it inefficiently limits what is possible later.

7. Preferred Shares: The Clause That Changes Everything
This is where many founders get caught out.
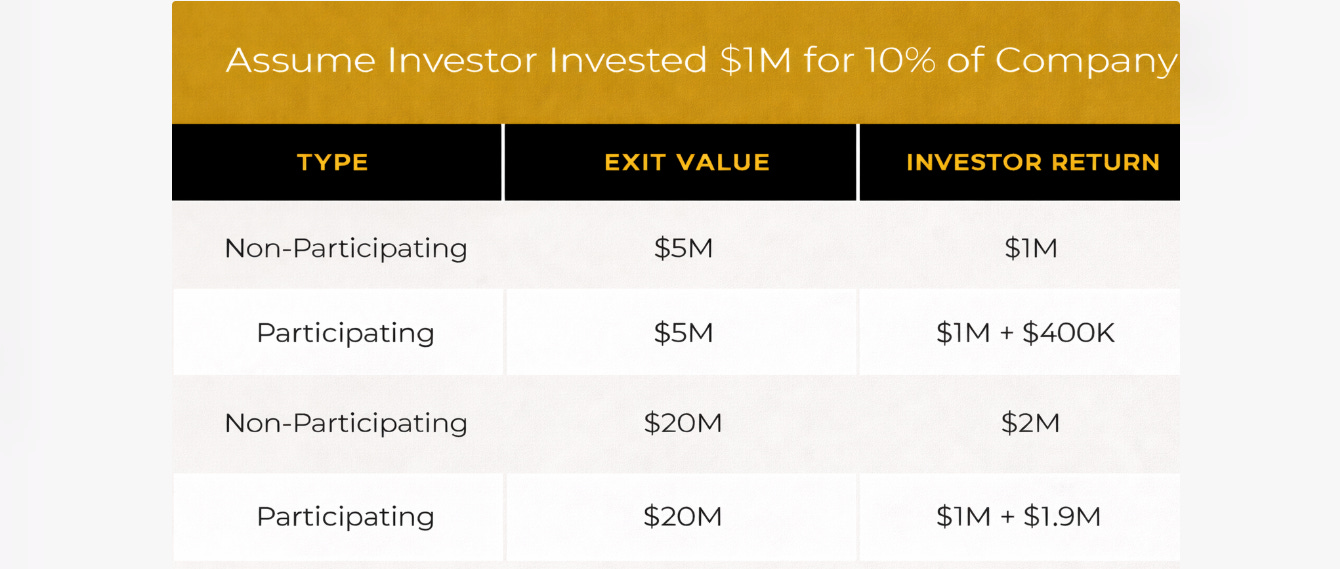
Most hear “1x liquidation preference” and assume it means the investor simply gets their money back first. That is only true for non participating preferred.
There are two common structures.
Non Participating Preferred
The investor chooses between:
taking their liquidation preference, or
converting to common and taking their ownership share
They do not get both.
Participating Preferred
The investor receives:
their liquidation preference first
and then also participates pro rata in the remaining proceeds
This distinction matters enormously in mid range exits.
Preferred shares exist to change outcomes. They determine who gets paid first, how much downside is protected, and how much upside investors take out of the pool that would otherwise flow to founders and employees.
8. The Same Exit, Two Very Different Outcomes
Assume:
Series B invests $5M for 25% ownership
Founders and employees hold the remaining common
The company exits at $40M
Non Participating Preferred
Option 1: Take preference
Investor gets $5M
Option 2: Convert to common
Investor gets 25% of $40M, which is $10M
Investor chooses the better outcome.
Result:
Investor takes $10M
$30M flows to common holders
Participating Preferred
Step 1: Investor takes $5M off the top
Remaining proceeds: $35M
Step 2: Investor participates with 25%ownership
25 percent of $35M = $8.75M
Total proceeds:
$5M + $8.75M = $13.75M
That extra $3.75M comes directly out of what would otherwise flow to founders and employees.
The structure, not the valuation, created the difference.
9. Exit Waterfalls: What Founders Really Take Home
Waterfalls make these mechanics visible.

They show exactly how proceeds flow through:
each preferred class
each preference
and then into common
Without a waterfall, founders anchor on the headline exit value. With one, they see when incentives align and when they do not.
Understanding this before signing a term sheet is the difference between hope and clarity.
10. The Story Your Cap Table Tells Without You Saying a Word
A cap table tells a story long before anyone opens your data room.
Founder ownership, option pool sizing, and preferred structures together reveal how decisions were made. They show whether equity was treated as a strategic resource or a short term fix. Investors look at the structure and infer discipline or drift.
Two companies with similar traction can feel very different once their cap tables are compared.
One signals foresight.
The other signals fragility.
A cap table does not just record ownership.
It reflects judgement.
Bonus: The Full Cap Table Model (Built for Real Rounds)
By now, the mechanics should be clear. Dilution isn’t a single event, and preferences don’t matter in isolation. The structure shifts gradually, then suddenly, and most founders only see the full picture when nothing can be changed.
This model is built to bring that visibility forward.

You can run the sequences that matter: different round sizes, different timings, different valuation anchors. Adjust the structure and watch how quickly ownership reshapes itself as the denominator moves.
It doesn’t predict the future.
It just removes the guesswork.
If you want a clean, reliable way to understand where your cap table is heading, this is the simplest place to start.
Keep reading with a 7-day free trial
Subscribe to The Founders Corner® to keep reading this post and get 7 days of free access to the full post archives.