

Founders think a VC is judging their company.
The product. The team. The growth.
The VC is also doing a different sum.
Could this company, on its own, pay back the entire fund?
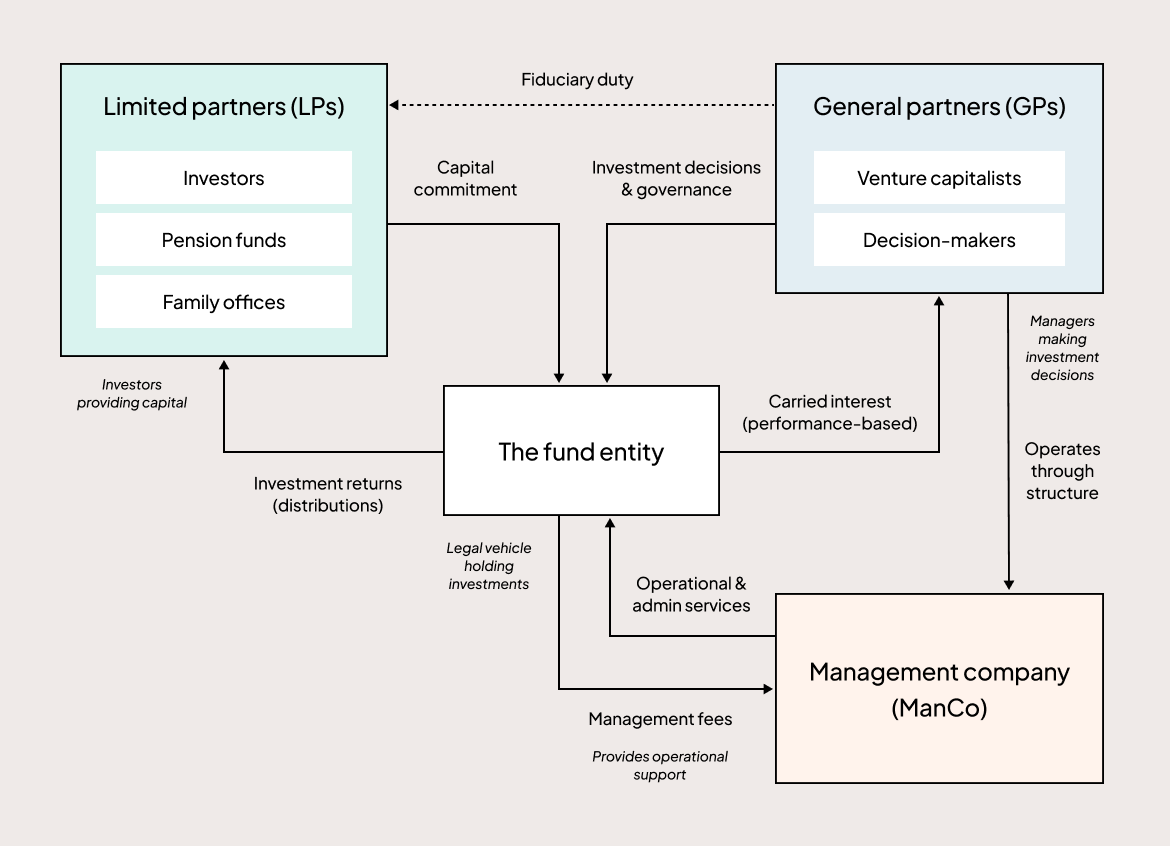
Most founders have never had the money side of venture explained to them.
So here it is, step by step, in plain English.
Want to get in front of 250k+ founders and investors?
For sponsorship opportunities across The Founders Corner newsletter and LinkedIn (160k followers), email: founderscornermedia@gmail.com
The Six Terms You Need
LPs (limited partners). The people who supply the money. Usually pension funds, university endowments, charities and wealthy families.
GP (general partner). The VC firm itself. It chooses which startups to back.
Fund. One pot of LP money, typically invested and returned over about ten years.
Exit. When a startup is sold or lists on the stock market, so its shares turn into cash.
Multiple. How many times over money comes back. Put in $1, get back $3: that’s 3x.
DPI. Cash actually paid back to LPs, as a multiple. Paper value doesn’t count.
Step One: The Money Belongs to Someone Else
The LPs promise, say, $100m. The VC invests it in about 20 to 40 startups, then hands back whatever those investments become.
The VC is paid in two specific ways.
Step Two: The 2% Fee, Paid No Matter What
The first is a management fee. It’s a yearly charge to cover salaries, offices and running the fund.
The usual rate is 2% of the fund a year. Carta’s 2025 Fund Economics Report tracked about 2,000 US funds, and the typical fee has been 2% every year since 2018.
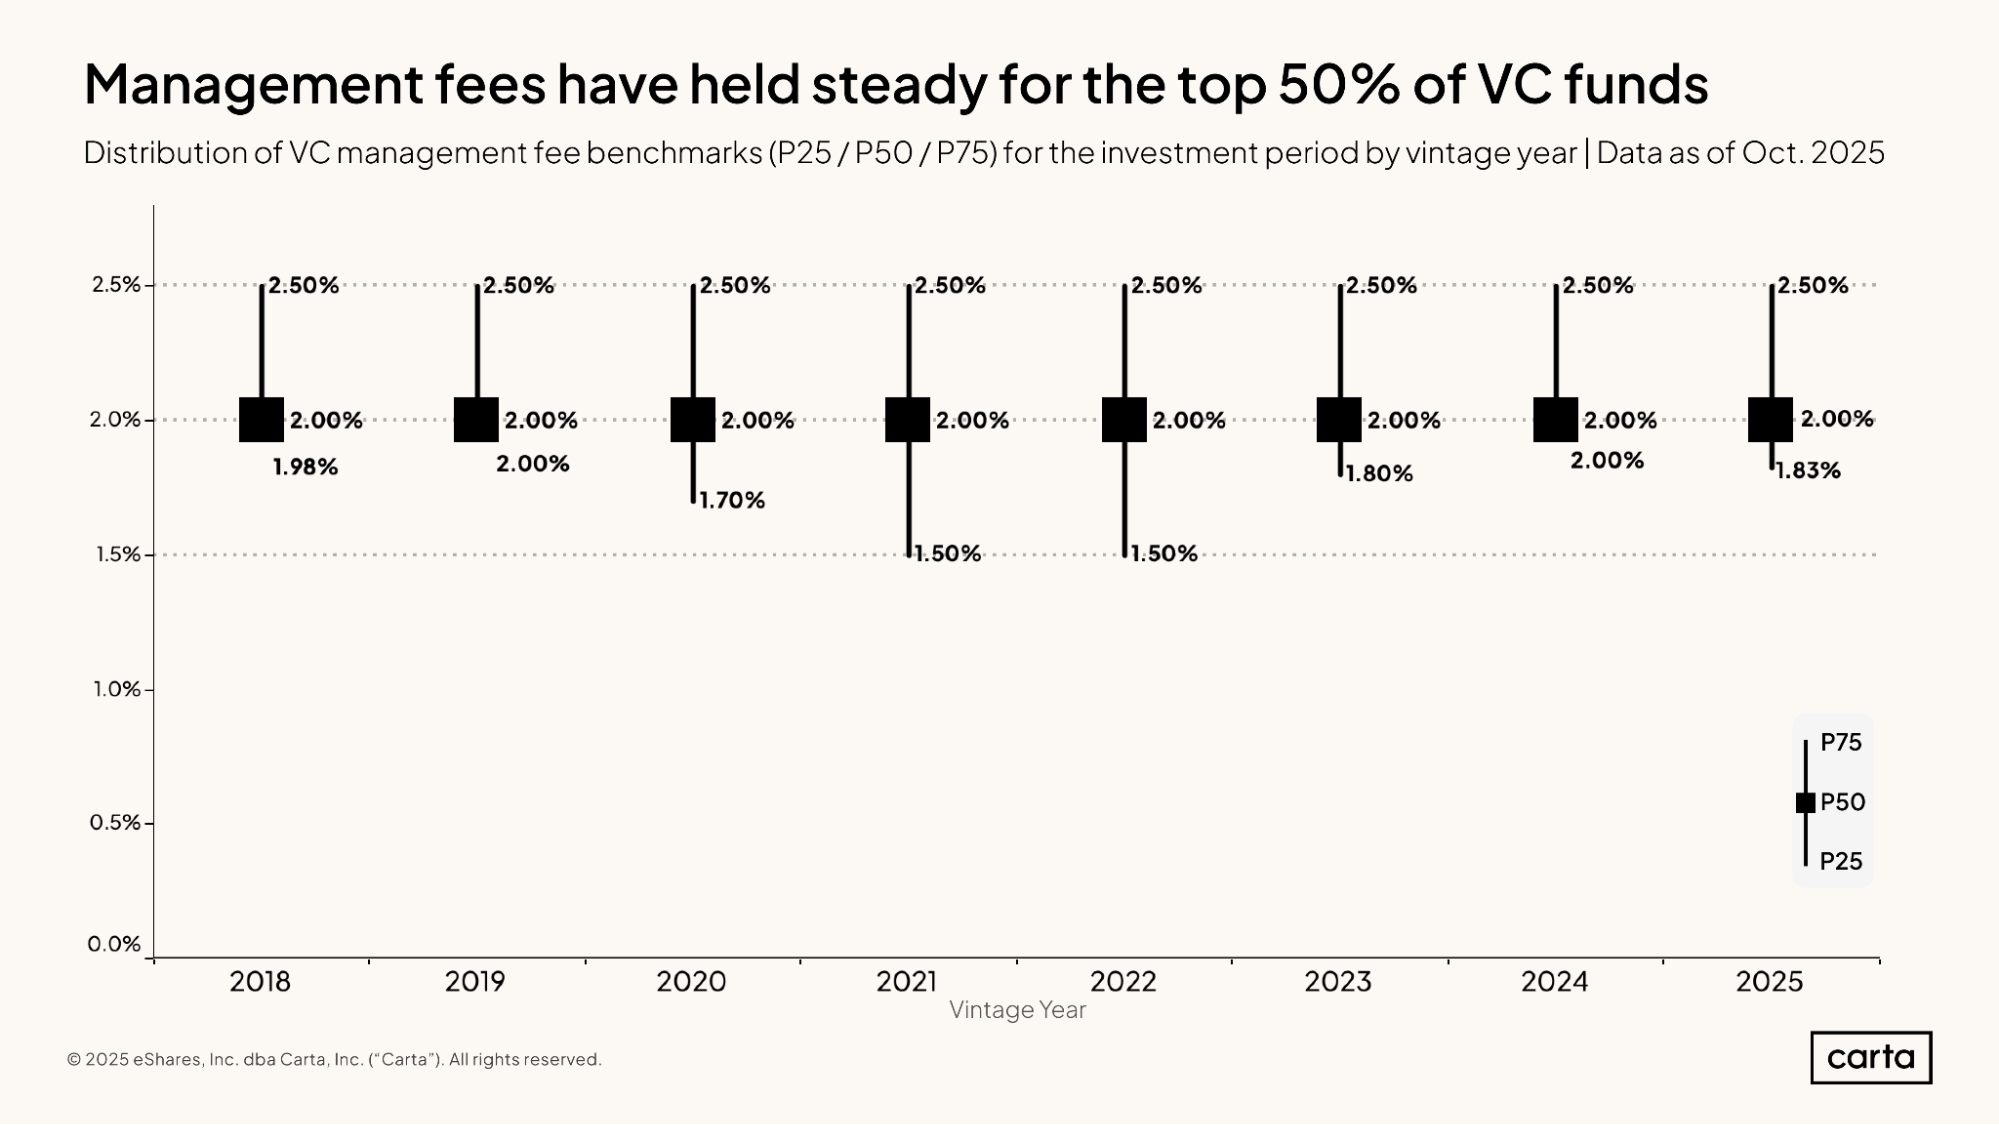
Most funds cut the fee once they stop making new investments.
A worked example. A $100m fund charges 2% for five years, then 1.5% for five more:
Years 1–5: $2m a year = $10m
Years 6–10: $1.5m a year = $7.5m
Total fees: $17.5m
So only $82.5m of the $100m ever reaches startups.
Step Three: The 20% Share of Profits
The second is carried interest, usually called carry. It’s the VC’s share of the profit.
In most funds, LPs get all their money back first. Only the profit on top is split, usually 80% to LPs and 20% to the VC.
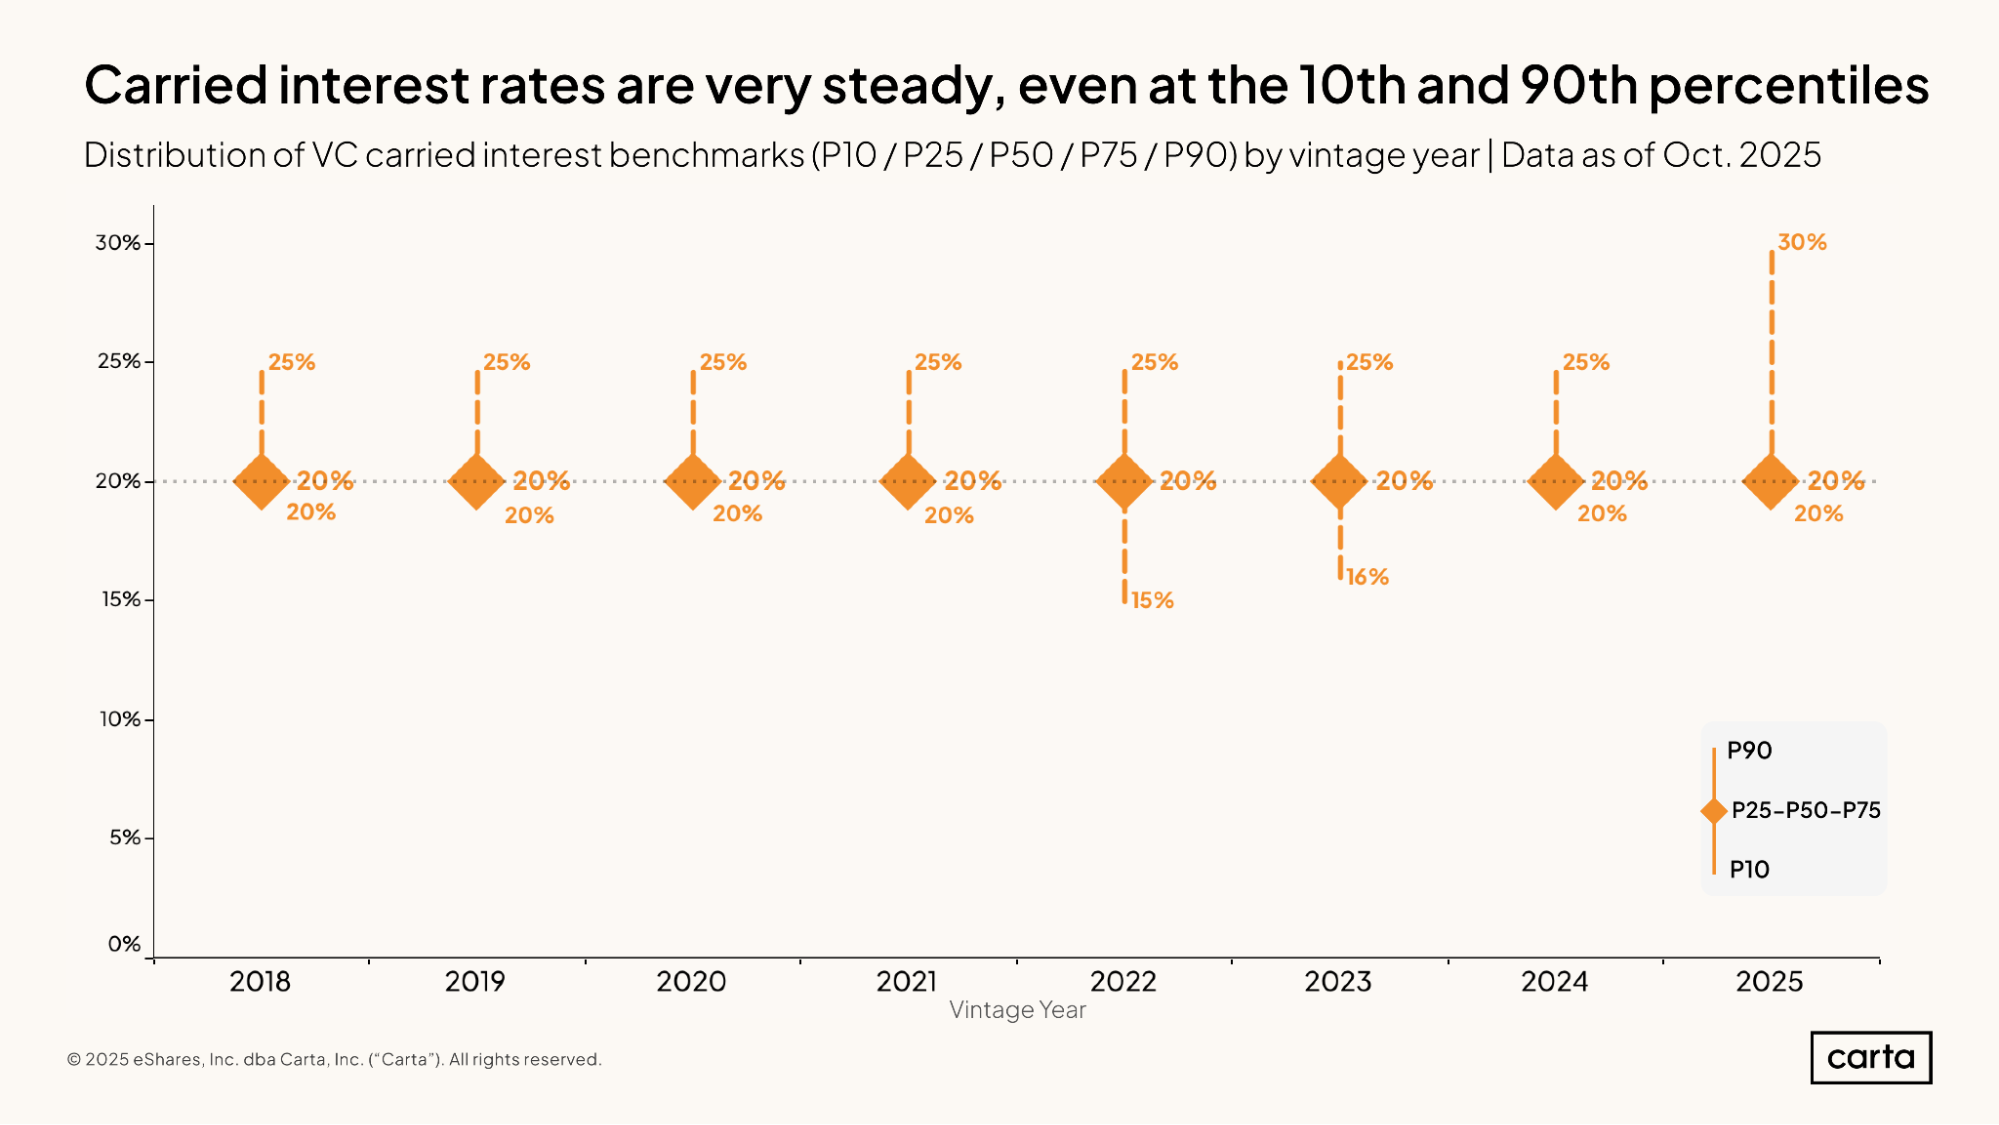
A worked example. The $100m fund eventually returns $300m:
LPs get their $100m back first
That leaves $200m of profit
The VC takes 20%: $40m
LPs take 80%: $160m, so $260m in total
That’s “2 and 20”. The fee keeps the firm running. Carry is where the real money is, and carry depends almost entirely on a few big wins.
Step Four: Most Startups Lose Money
Correlation Ventures looked at 21,640 US startup investments between 2004 and 2013.
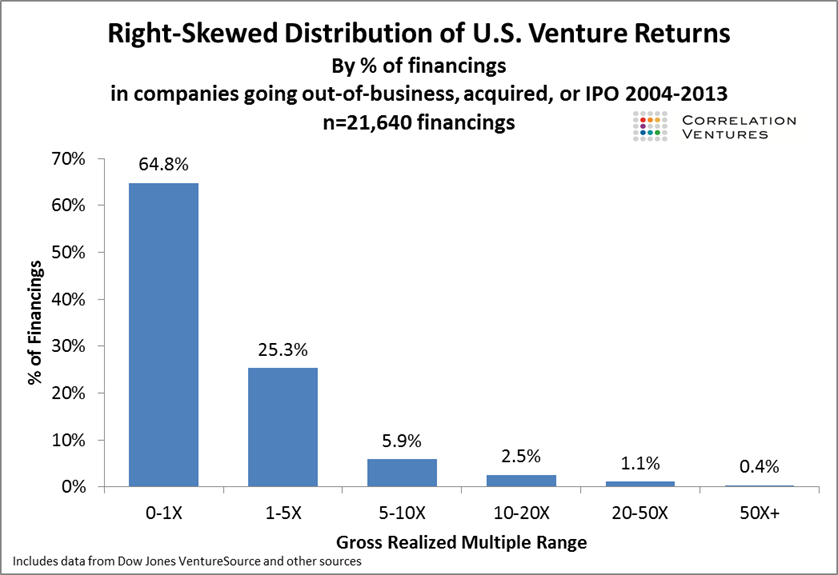
In plain terms, out of every 100 investments:
65 returned less than was put in
25 returned between 1x and 5x
6 returned 5x to 10x
4 returned 10x or more
This lopsided pattern is called the power law. A handful of huge winners pay for everything else.
That’s why VCs ignore “safe” businesses. A company that can only double its money can’t make up for the losers.
Step Five: The Best Funds Lose More, Not Less
Horsley Bridge has invested in hundreds of VC funds since 1985. In 2015 Andreessen Horowitz (a16z) published its data.
About 6% of investments produced roughly 60% of all the returns.
The top funds weren’t better at avoiding losses. They simply had more giant winners.
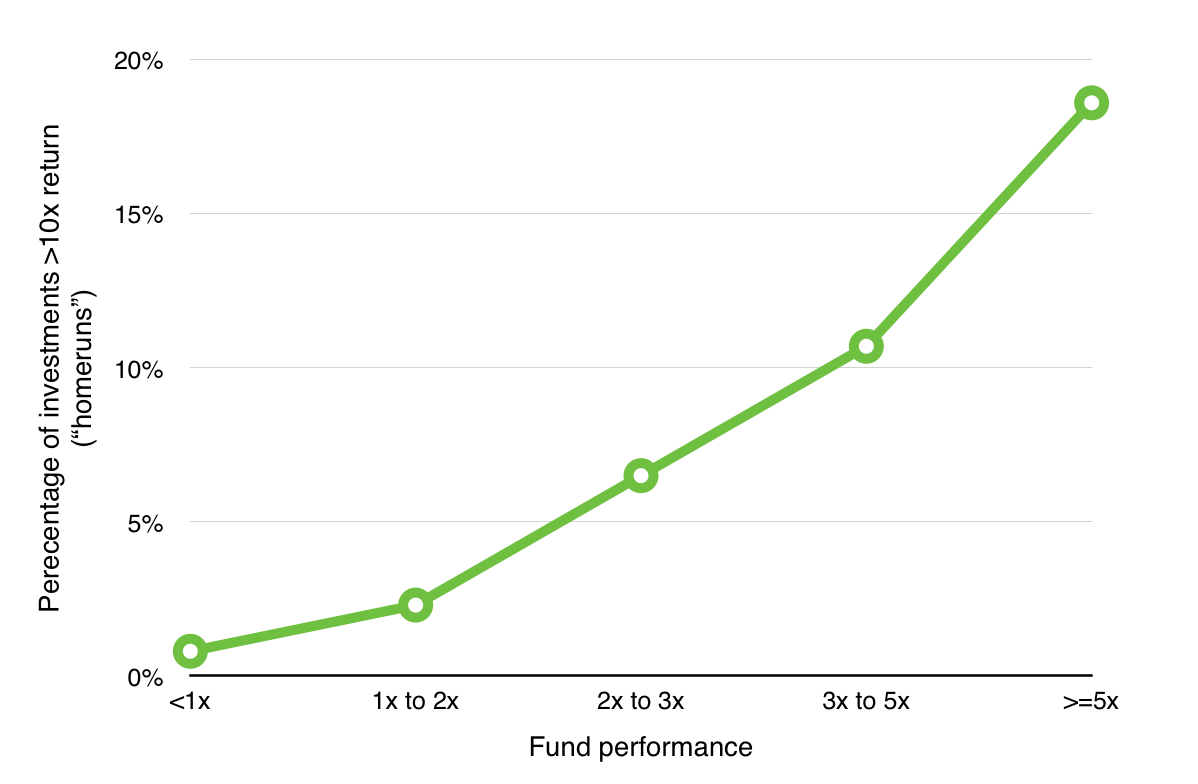
They even lost money on more deals, because they took bigger swings.
The Fair Criticism
In 2012 the Kauffman Foundation reviewed twenty years of its own investments in VC funds. Of 88 funds, 69 failed to beat the stock market by enough to justify the risk and the wait.
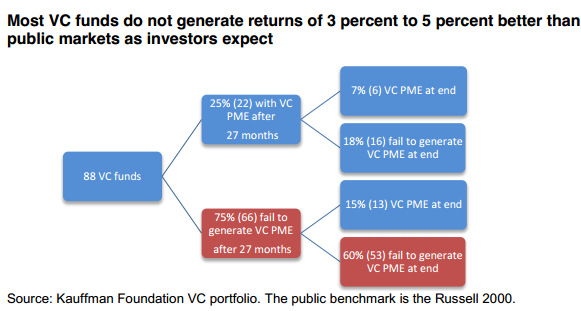
Its point: the fee pays VCs well even when investors lose.
Both views hold. Venture works brilliantly for the few funds that land a giant winner, and poorly for most.
Our Most-Read Articles Right Now
🔥 The Way VCs Actually Calculate Your Valuation The return maths that sets your price before the meeting starts.
🔥 I Ran a Startup Through a VC Investment Committee. It Died in Four Minutes. The memo and the verdict, before you walk in.
📋 What a Cap Table Actually Is (And Why Most Founders Misread It) What your ownership tells investors before you say a word.
📈 The 169 VCs Leading Rounds Right Now Who actually led a round in the last ninety days.
Step Six: The Exit Size Your Investor Needs
This is where it hits founders.
A VC owns a slice of your company. Each new funding round shrinks that slice a little more.
The simple test: fund size ÷ the VC’s slice at exit = the sale price needed to pay back the whole fund.
$100m fund owning 10% at exit: your company must sell for $1bn
$500m fund owning 10%: $5bn
But paying back the fund is only break-even. Funds aim for about 3x after fees and carry. Chronograph calculated what that takes.
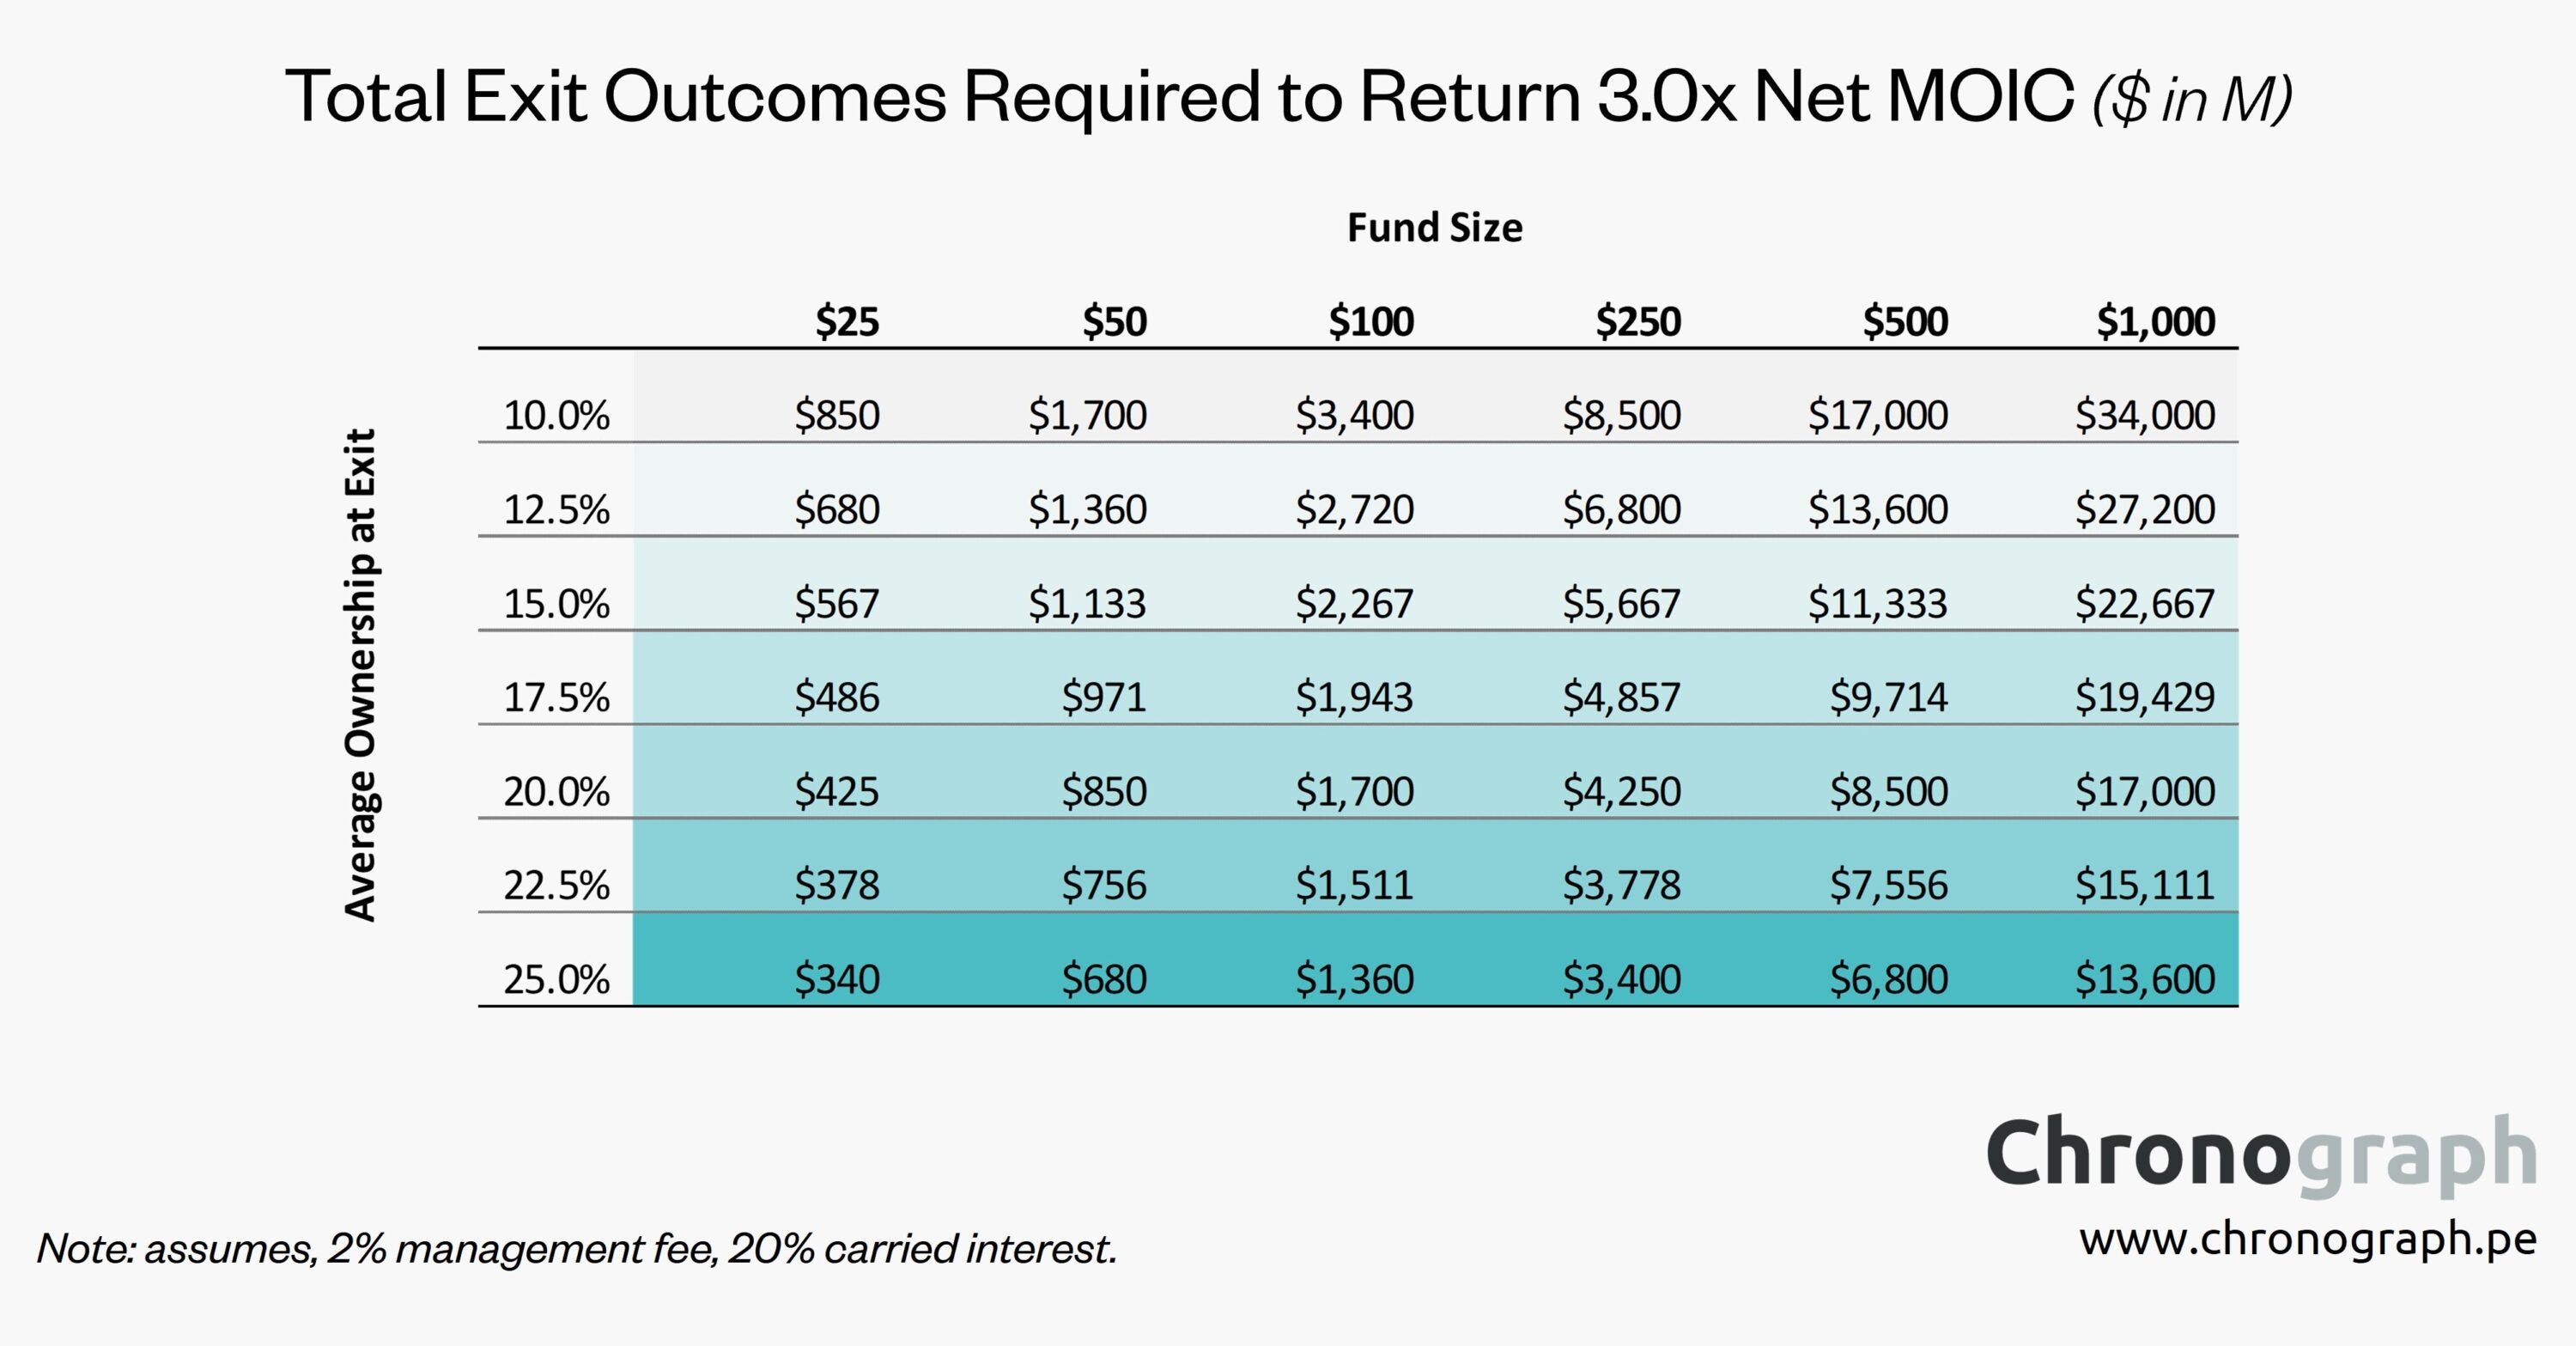
A $100m fund owning 10% needs its startups to sell for $3.4bn in total. A $1bn fund needs $34bn.
A $300m sale changes a founder’s life. To a $1bn fund, it barely registers.
That’s why “too early for us” can really mean “too small for our fund”.
Step Seven: Investors Wait a Decade for Cash
LPs pay fees and fund investments for years before any company is sold. Their balance goes down first, then climbs back up.
On a chart that looks like a J, so it’s called the J-curve.
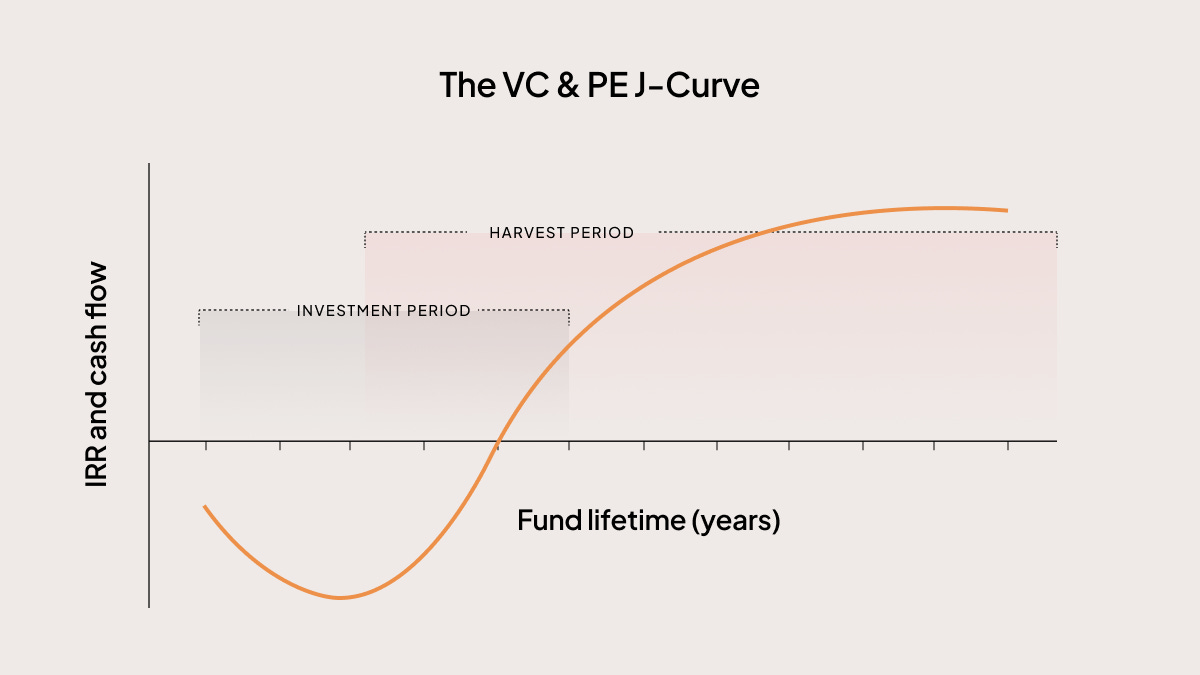
The wait has got longer. Carta tracks how many funds have paid back any cash at all.
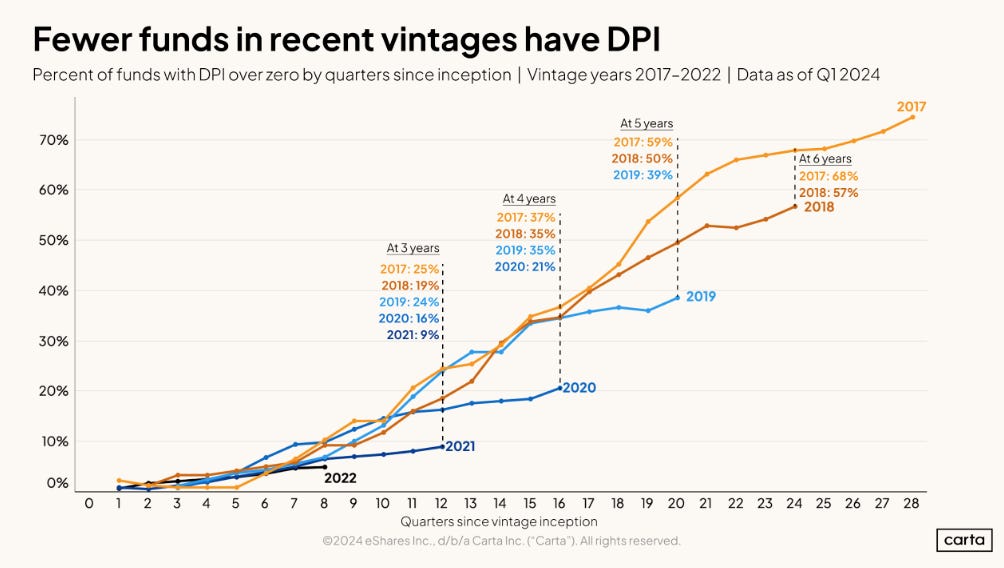
Carta’s Q1 2026 data shows that among funds started in 2017 and 2018, fewer than 20% have returned even the money investors put in.
A fund can look valuable on paper without paying anyone. That’s why investors now ask about DPI, the cash returned, first.
What This Means for You
Founders. Before you pitch, check the fund’s size and divide by the slice it would own. If your realistic best outcome is smaller, find a smaller fund.
VCs. The fee is guaranteed but carry isn’t. Make enough investments to have a real shot at one giant winner.
LPs. Ask the VC what the fund looks like without its single best company. That’s the honest view of its skill.
“A venture fund isn’t thirty bets. It’s one bet, placed thirty times, waiting to find out which one it was.”
Before You Sign Anything
A VC fund lives or dies on a few huge wins.
So every investor is quietly asking one question about you: could this be the one?
Answer it before they do. Divide the fund’s size by the stake they’d hold when you sell, then compare that with your honest best case.
The spreadsheet does the sums for you.
Inside the Spreadsheet: A Whole VC Fund, Modelled
What each tab does:
Dashboard. 12 headline numbers, including investor returns, fees, carry and the result without the best company
Inputs. Fund size, fees, carry, startups, ownership and timing, all editable
Portfolio Outcomes. Where the money went and where returns came from
Distribution Waterfall. Exactly who gets paid what, in what order
Cash Flows. 12 years of money in and out, and the J-curve
Return the Fund. The sale price needed across six fund sizes and six ownership levels
Market Benchmarks. 13 published data points, each linked to its source
Enter your fund, switch off the best company, and see what it was carrying.
Paid subscribers also get:
60+ additional tools across every stage of fundraising and company building: investor research, pitch deck screening, meeting prep, term sheet analysis, financial models, and the full investor database library.
The VC Fund Economics Model
Download below