

Ask a founder for their growth rate and the answer comes instantly.
Month over month, quarter over quarter, whatever makes the line steepest.
Ask the same founder how long it takes to recover the cost of acquiring a customer, and the answer slows down.
That gap is not an accident. Growth is the number founders are taught to perform. Payback is the number investors are trained to check first, quietly, before they say anything about the growth at all.
A dollar spent on acquisition that takes 30 months to come back is a very different dollar from one that comes back in three, even if both dollars bought the exact same customer.
So I built a tool that runs your own numbers through the same lens.
Brought To You By Omnisend

Most founders don’t have a retention team.
They have a dashboard nobody opens and an email list quietly leaving money on the table.
Omnisend just changed that.
Your whole email and SMS operation now runs from inside Claude and ChatGPT.
No logins. No dashboards. No agency retainer.
You type: “Which automations made the most money in the last 30 days, and which ones aren’t pulling their weight?”
It pulls your real numbers, tells you what changed and why, then builds the fix.
It handles segments, campaigns, deliverability audits and a monthly summary you can forward to your team.
Each one takes a single prompt.
This is what AI in a startup should feel like: less chat, more done.
Switching costs you nothing either. Omnisend’s team migrates your entire setup in 5 days, free: flows, templates and lists.
You could be paying up to 35% less by next week.
150,000+ brands already run on it. $79 back for every $1 spent.
👉 See what one prompt can do here
What Payback Actually Measures
CAC payback answers one question: how many months of gross profit from a customer does it take to earn back what you spent to acquire them?
The formula:
CAC Payback (months) = CAC ÷ (Monthly Revenue per Customer × Gross Margin)
Not revenue recovery. Gross-profit recovery. That distinction is why two companies with identical revenue growth can post wildly different payback: the one with worse margins is quietly funding its growth for longer.
It matters more than almost any other single metric because it is a speed measure sitting inside a business that is usually being judged on speed. Growth rate tells an investor how fast you’re moving. Payback tells them how fast you get paid back for moving.
Every month of payback beyond your cost of capital is estimated to erode roughly 8% of valuation, per Bessemer’s growth-stage framework, which is why a partner will quietly do this maths in their head while you’re still on the market-size slide.
What “Good” Actually Looks Like in 2026
The median B2B SaaS company takes 16 months to recover its CAC, according to 2025 data compiled across 342 companies by Aleph and Benchmarkit. Top-quartile companies do it in 6 months or less. The bottom quartile stretches past 24.
Bessemer’s own rating scale, used inside real investment committees, is blunt about where each band lands:
0 to 6 months: best
6 to 12 months: better
12 to 18 months: good
18 to 24 months: concerning
24+ months: critical
ACV moves this more than anything else. Sub-$5K contracts recover in around 11 months on median. $50K to $100K enterprise deals stretch to roughly 22, because longer sales cycles and longer onboarding push the recovery date out. That’s structural, not a failure.
There’s a counterintuitive wrinkle in the growth-rate data too. Companies growing over 50% a year post a median payback of just 10 months. Companies growing a more modest 21 to 30% post the worst median in the dataset, at 22 months. Fast growth and efficient acquisition are not opposites: the companies that have actually found a repeatable motion tend to do both at once. The 22-month cohort hasn’t found the motion yet; they’re just spending harder to compensate for not having it.
That’s the number an investor is silently benchmarking you against. Here’s how to see your own.
Running Your Own Numbers
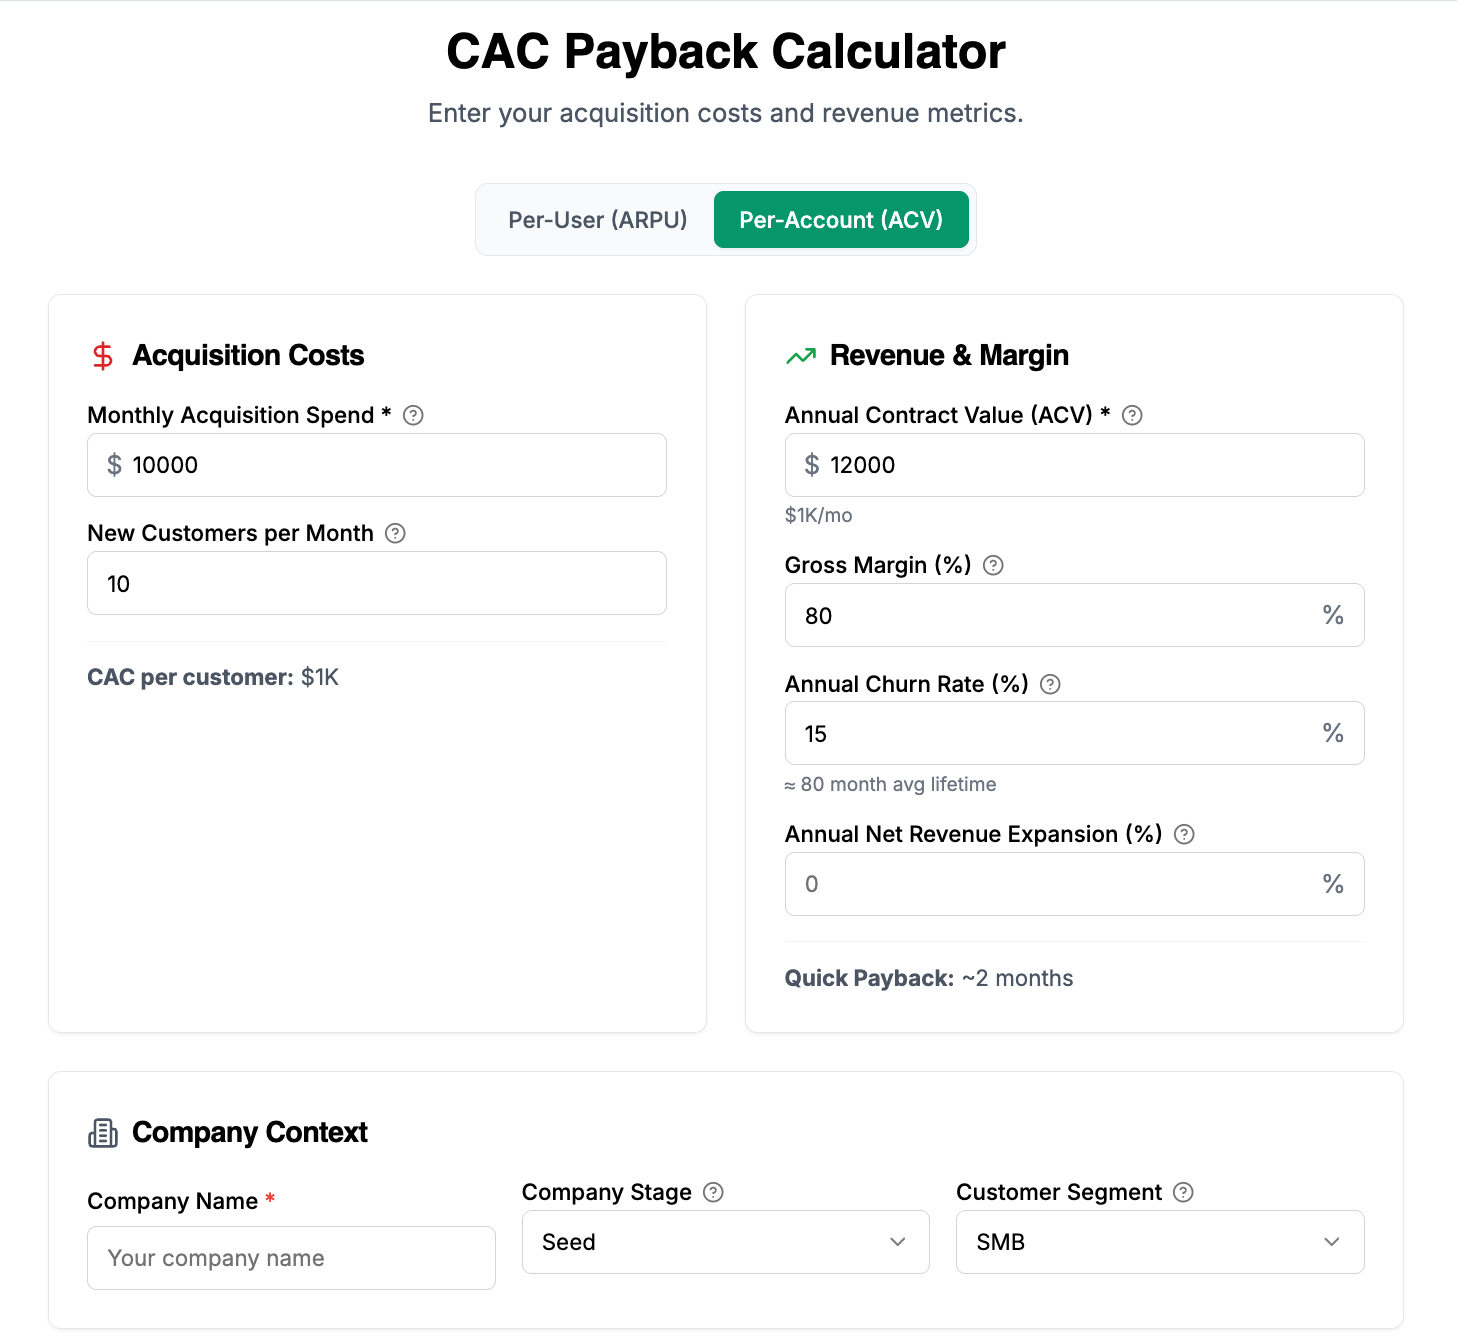
The input screen asks for exactly what a diligence process asks for, nothing more:
Acquisition Costs. Monthly spend and new customers per month, which the tool immediately turns into a raw CAC per customer.
Revenue & Margin. Your ACV (or ARPU, if you toggle to per-user), gross margin, annual churn, and any net revenue expansion. Churn alone gets converted into an average customer lifetime in months, sitting right under the field, so you see the assumption before it disappears into a formula.
Company Context. Stage and segment, because a 12-month payback means something completely different at Seed than it does at Series C.
In the example above, $10,000 in monthly spend against 10 new customers, a $12,000 ACV, 80% gross margin, 15% annual churn, the raw CAC lands at $1,000 per customer and the quick-read payback comes back at roughly two months, before the tool has even run the full model.
Our Most-Read Articles Right Now
🔥 How Investors Decide If You Are Ready to Raise, in Under 5 Minutes The stage-by-stage benchmarks that tell you if you’re six months early.
🔥 The Investor Scorecard You Were Never Supposed To See The internal sheet a partner is filling in while you pitch.
📈 The Pitch Deck Test Investors Use in 30 Seconds, Now You Can Too The silent filter that decides if your deck gets a real read.
📋 The Investors Who Actually Write Cheques In 2026 The capital that doesn’t call itself venture, and how to reach it.
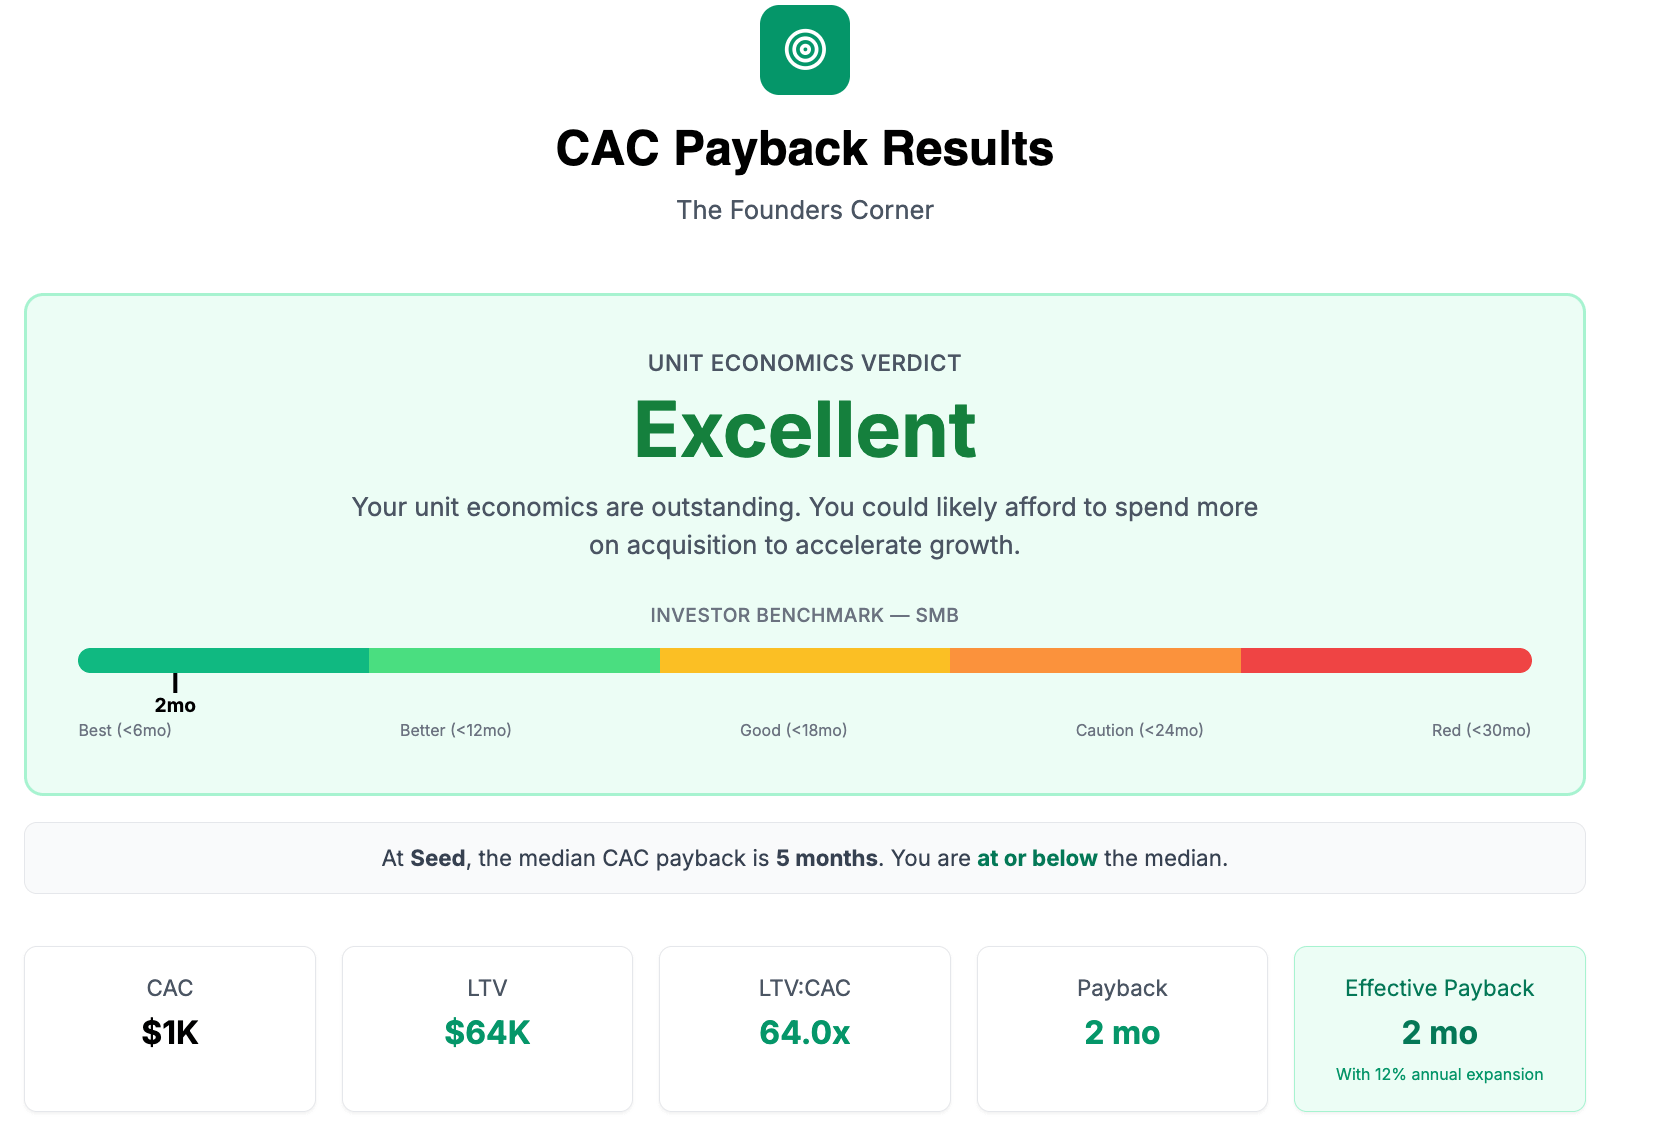
The result screen does the part most spreadsheets skip: it puts your number next to the number that actually matters, which is the one for your stage and segment, not the generic B2B blend. That $1K CAC against an ~80-month customer lifetime returns an LTV:CAC ratio of 64.0x, a real, if unusually clean, illustration of what “excellent” looks like against the gold-standard 3:1 benchmark investors screen for.
Effective payback compounds in any net revenue expansion you entered, because a customer who expands pays you back faster than the raw margin math alone would suggest.
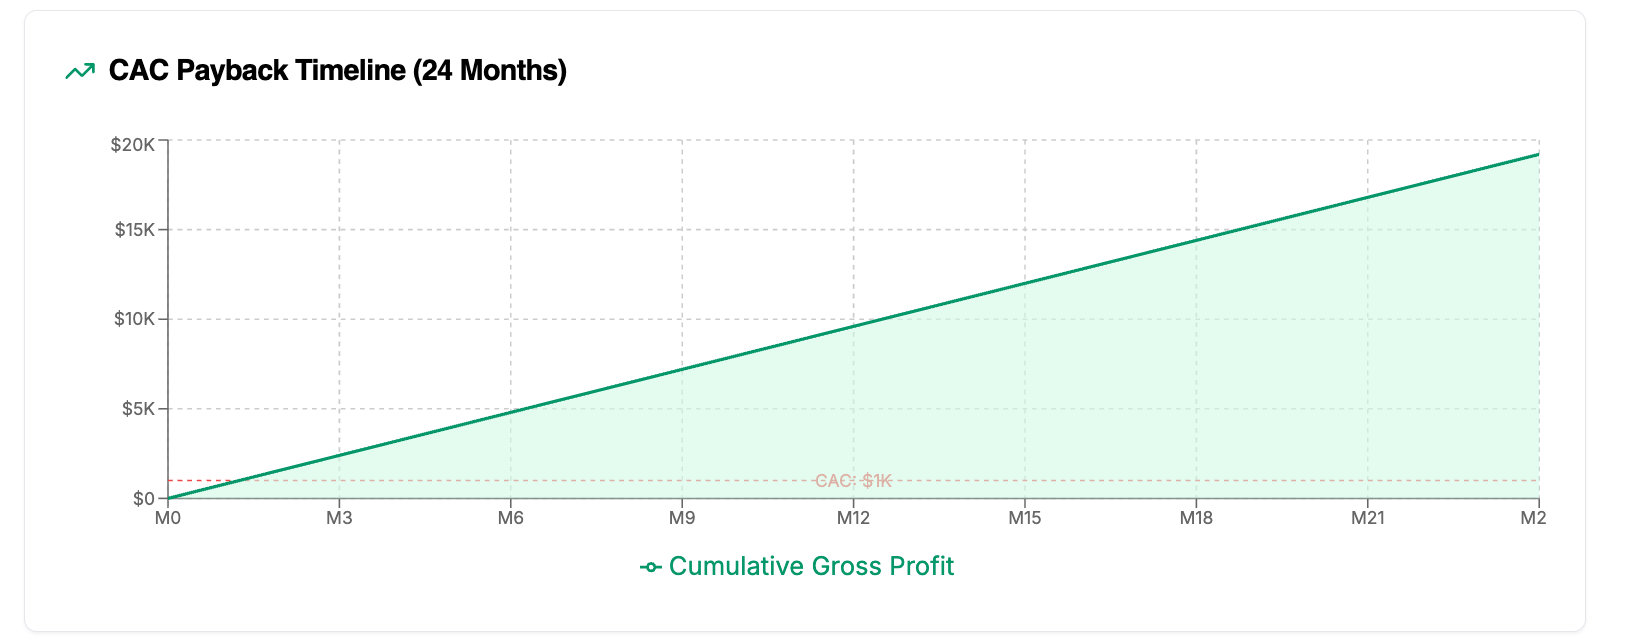
The timeline chart is the slide version of the same number. A dashed line marks CAC. A rising line marks cumulative gross profit. The month those two lines cross is your payback period, drawn rather than calculated, which is usually the version that survives being screenshotted into an actual board deck.
The Three Levers, and Why They’re Never Equal
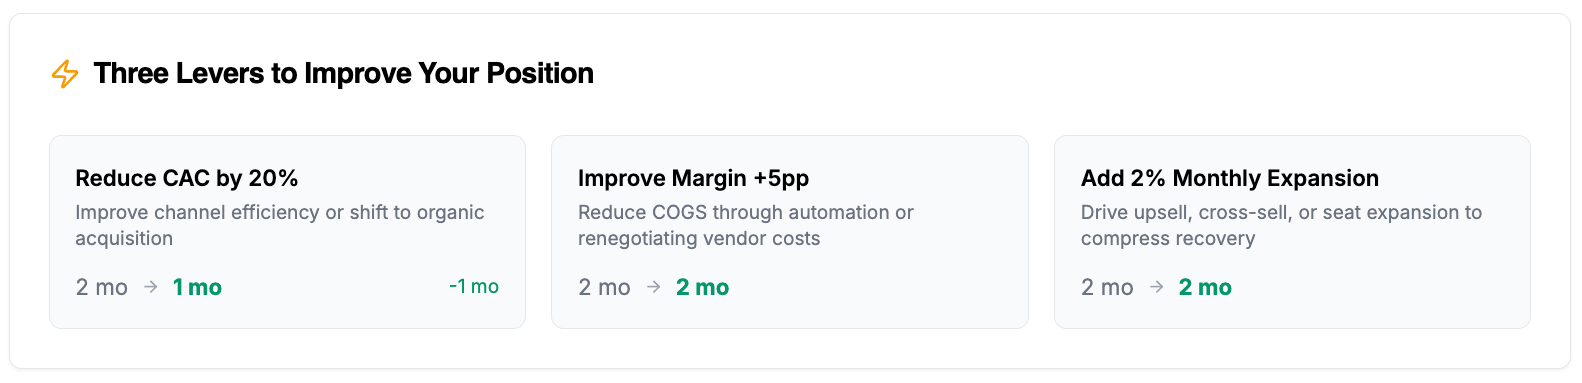
Every CAC payback problem has exactly three levers. Reduce what you spend to acquire. Improve the margin on what they pay. Get them to spend more over time. Every fix a founder makes eventually collapses into one of those three.
What the tool does that a whiteboard can’t: it runs all three against your specific inputs and shows which one is actually load-bearing, because the honest answer is different for every company. For a company already sitting on an 80% margin, five more points of margin barely nudges a 2-month payback; there’s not much room left to compress. Cutting acquisition cost by a fifth, on the other hand, can shave a full month off a number that’s already excellent, because CAC has no floor the way margin has a ceiling.
Run your own numbers and the tool will tell you which lever is yours. For a Seed-stage SMB motion with thin CAC and fat margin, it’s rarely the same lever that saves an enterprise deal with a nine-month sales cycle and 60% margin. Knowing which lever is actually yours, rather than defaulting to “cut CAC” because that’s the instinctive answer, is most of what separates a founder who fixes payback in one quarter from one who spends a year optimizing the wrong line.
“Growth tells an investor how fast you’re moving. Payback tells them how fast you get paid back for moving, and it’s the second question, not the first, that decides whether they lean in or go quiet.”
What To Do With Your Number
Founders track growth because it’s the number that gets celebrated.
Investors track payback because it’s the number that reveals whether the growth is solvent.
A 2-month payback and a 24-month payback can sit under the exact same growth-rate slide, and only one of those companies can survive slowing down.
The fix is not complicated: know your number, know your stage’s benchmark, and know which of the three levers, CAC, margin, or expansion, is actually yours to pull. Guessing costs a fundraise. Running the model costs ten minutes.
Run this before your next investor call, not after the question lands and you’re doing the maths on the spot.
The CAC Payback Calculator
Exactly what you’re getting:
Payback Engine. Enter acquisition spend, ACV or ARPU, gross margin, churn and expansion. Returns raw CAC, LTV, LTV:CAC ratio, quick payback, and effective payback with expansion compounded in
Stage-Benchmark Verdict. Your payback scored against Bessemer’s five-band scale and your specific stage-and-segment median, not a generic blended number
24-Month Timeline Visual. Cumulative gross profit plotted against your CAC line, so the recovery month is something you can point to rather than calculate live
Three-Lever Model. Reduce CAC by 20%, improve margin by 5pp, or add 2% monthly expansion, each run against your own numbers so you see which lever actually moves your specific payback period, not a generic one
Enter your real numbers first, read the verdict against your stage, then use the lever panel to find the one change that’s actually worth making this quarter.
Paid subscribers also get:
60+ additional tools across every stage of fundraising and company building: investor research, pitch deck screening, meeting prep, term sheet analysis, financial models, and the full investor database library.