
The Number That Kills More Fundraises Than Any Bad Idea
Every investor asks it. Most founders get it wrong. Here’s why your market size slide is either your strongest asset — or the quiet reason you’re not getting a second meeting.

There’s a slide in almost every pitch deck that investors say they want.
They study it. They probe it. They use it to decide, within the first ten minutes, whether you’re someone who understands your own business — or someone performing the appearance of understanding it.
It’s the market size slide. TAM. SAM. SOM.
And the vast majority of founders get it catastrophically wrong.
Not wrong like the numbers are off. Wrong like the entire approach is off. Wrong like you’ve told a VC the global logistics market is $8 trillion and expected them to be impressed. Wrong like you’ve drawn three concentric circles with big numbers inside them and called it analysis.
Here’s what no one says out loud: to most experienced investors, a badly constructed market size slide is worse than having no market size slide at all. It doesn’t just fail to help your pitch. It actively signals that you don’t understand how to think about your own opportunity.
This piece exists to fix that.
We’re going to break down what TAM, SAM, and SOM actually mean — not the textbook definitions, but the investor definitions. We’re going to show you the mistake that kills most founder presentations before they’ve even started. And we’re going to walk through the method that elite investors actually want to see.
By the end, you’ll never look at a concentric circles diagram the same way again.
That’s the point.
What TAM, SAM, and SOM Actually Mean
Before anything else, a confession: these three acronyms are more confusing than they should be.
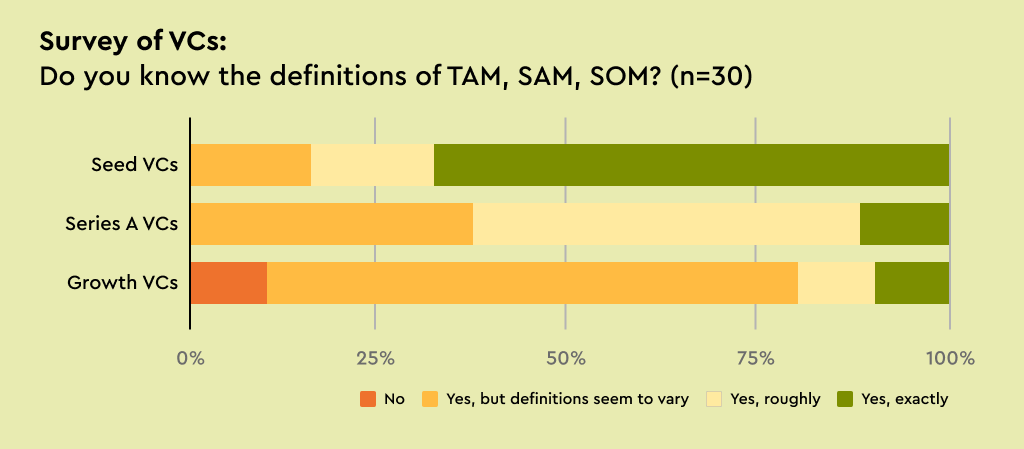
The textbook definitions are vague. Ask ten VCs what the difference between TAM and SAM is and you’ll get ten slightly different answers. Pear VC surveyed 30 investors on this exact question — the results were illuminating.
So rather than give you the academic version, here’s the version that matters for fundraising:
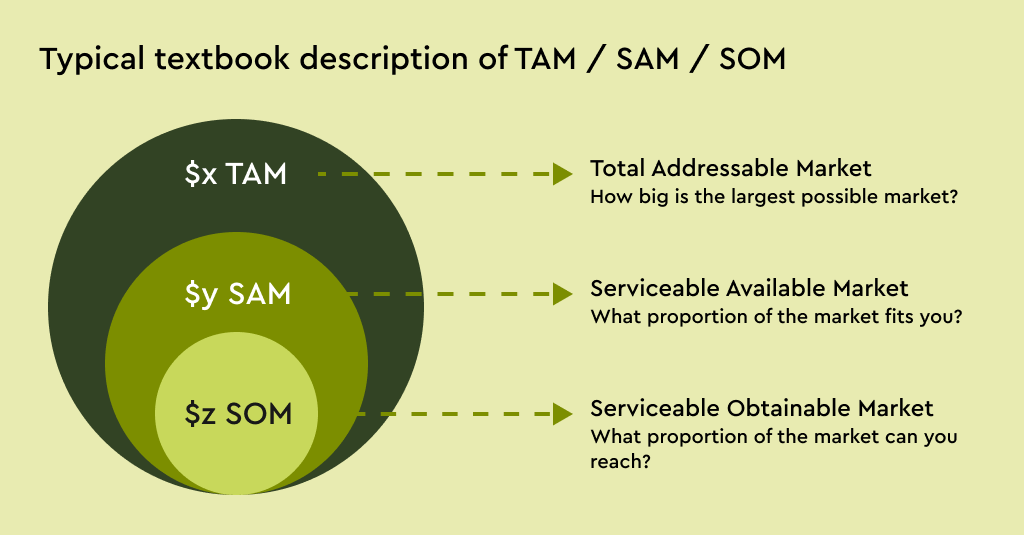
TAM — Total Addressable Market The full revenue opportunity if you captured 100% of the market. Everyone who could ever need what you’re building, everywhere, paying what you’d charge. This is the universe. You will never capture it. That’s not the point. The point is to show the ceiling is high enough to justify building a venture-scale business.
SAM — Serviceable Addressable Market The segment of the TAM you can actually reach with your current product, pricing, and distribution. Not everyone in the world — the slice your business model can realistically serve. This is where your unique market insight lives. The quality of your SAM tells an investor whether you’ve done the work of understanding your customer or whether you’ve just taken a large number and cut it in half.
SOM — Serviceable Obtainable Market The share of your SAM you can realistically win — typically in your first three to five years. This is where your go-to-market strategy becomes a number. It’s your SOM that connects directly to your revenue projections. If a VC can’t draw a clear line between your SOM and your Year 3 forecast, your slide isn’t working.
Think of it as a target. TAM is the wall. SAM is the target on the wall. SOM is the bull’s eye you’re actually aiming at — right now, with what you have.
The failure mode? Founders treat TAM like the prize. Investors are looking at SOM.
The Mistake That Ends Fundraises
Here it is. The single mistake that kills more market size slides than any other.
“The global [X] market is worth $Y trillion.”
You’ve seen it. You’ve probably written it. It goes something like this:
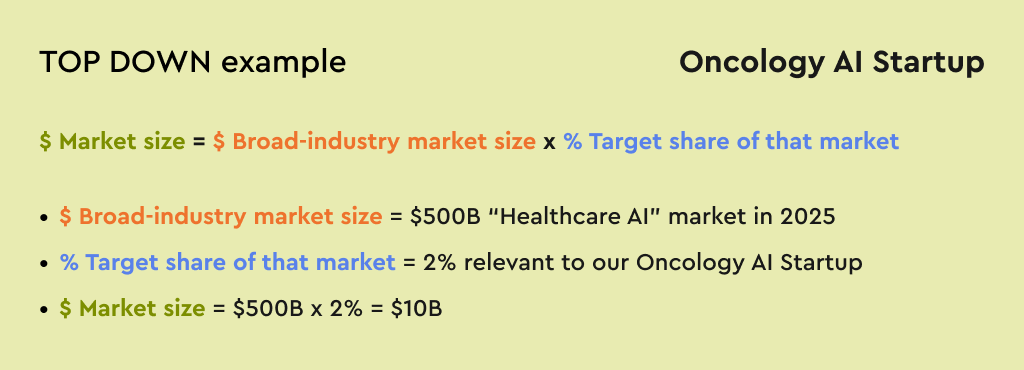
“The global fitness app market is worth $14 billion. We are targeting 2% of this market, which represents a $280M opportunity.”
This is called top-down market sizing. And experienced investors — the ones who’ve sat through hundreds of these presentations — see it as a red flag, not a headline.
Why? Because it tells them almost nothing useful.
It doesn’t tell them who your customer is. It doesn’t tell them what they pay. It doesn’t tell them how you’ll reach them. It doesn’t tell them whether 2% of a $14 billion market is actually achievable given your sales motion, your pricing, and your team size. The number came from a market research report. The 2% came from nowhere.
What the top-down approach actually communicates: I found a big number on Google and divided it.
Pear VC’s survey of 30 investors delivered a clear verdict: the most consistent feedback from VCs was to stop presenting future revenue based on a percentage share of a large addressable market. It’s not a credibility-builder. It’s a credibility-destroyer.
The good news? There’s a better way. And it’s not harder. It’s just different.
🔒 This Is Where It Gets Useful
What follows is the part most founders never see.
The bottom-up methodology that top-tier investors actually trust — broken down step by step. How to size your SAM in a way that survives a partner meeting. What VCs at seed, Series A, and growth stage are each looking for — and why the same slide lands differently in every room. The Airbnb market slide that convinced Sequoia, dissected. The three questions your market size slide must answer before you walk into any room. And a bottom-up calculator that builds your TAM, SAM, and SOM from scratch — with every assumption editable, every number defensible, and a narrative explanation ready to use in your next pitch.
This is the work. It’s behind the paywall. Unlock it below.
Unlock the Full Article + Calculator →
The Method Investors Actually Trust: Bottom-Up
Keep reading with a 7-day free trial
Subscribe to The Founders Corner® to keep reading this post and get 7 days of free access to the full post archives.