
The Number That Gets You Funded (Or Kills You In The Room)
Your CAC Payback Period is the metric investors probe hardest. Most founders walk into that conversation underprepared.

There’s a moment in almost every fundraising conversation where the room changes.
The pitch has gone well. The deck is clean. The growth story has landed. Then an investor leans forward and asks: “What’s your CAC payback period?”
The founders who answer with fluency, who can speak to it by cohort, by channel, by customer segment, tend to close. The ones who pause, or give a number they can’t defend, tend not to. Because the room doesn’t go quiet when your number is bad. It goes quiet when the product was solid, the growth was there, but the numbers didn’t tell a coherent story.
That’s a unit economics problem. And CAC payback is ground zero.
This article is about making sure you’re in the first camp.
What CAC Payback Actually Measures
Your Customer Acquisition Cost (CAC) is the fully-loaded cost of winning one new customer: sales salaries, marketing spend, tools, events, commissions. Your CAC payback period is the number of months it takes to recover that cost through the gross profit that customer generates.
The formula is straightforward:
CAC ÷ (Monthly ARPU × Gross Margin %) = Months to recover
So if you spend £100 to acquire a customer who pays £50 per month at 80% gross margin, your payback is 2.5 months. If that same customer pays £20 per month at 60% margin, you’re at 8.3 months. Push beyond 18 months and investors start asking hard questions. Push beyond 24 and you’ll need exceptional retention metrics to compensate.

The benchmarks that matter:
Median SaaS CAC payback in 2024: 18 months
Where investors want you to be: under 12 months
Minimum LTV:CAC to fundraise confidently: 3:1
Why Investors Care So Much About It
When an investor probes your CAC payback, what they’re really asking is: how much of my capital disappears before it comes back?
Every pound raised gets deployed to acquire customers. A 24-month payback means that capital is tied up for two years before it can be recycled into more growth. In a climate where runway is scrutinised and burn rates matter, that’s not just an efficiency problem. It’s a structural one.
“CAC payback period determines how much cash the company needs to grow.” — Tom Tunguz, Partner at Redpoint Ventures
A sub-12-month payback creates something fundamentally different: a self-funding growth engine. The profits from existing customers fund the next cohort of acquisition. Growth becomes less dependent on fresh capital, which means better terms, less dilution, and far more negotiating leverage in the room.
Flip it around and a 24-month payback means every new customer requires an injection of outside capital to exist. That’s not a growth strategy. It’s a dependency.
Bessemer Venture Partners puts it plainly in their Scaling to $100M report: for SMB-focused companies, target CAC payback under 12 months. For mid-market, under 18. For enterprise, under 24. These aren’t soft guidelines. They’re the benchmarks their investment team uses when evaluating deals.

BVP benchmarks (State of the Cloud, 2023):
CAC Payback 12–18 months = Good
CAC Payback 6–12 months = Better
CAC Payback 0–6 months = Best
The Three Components Most Founders Get Wrong
CAC payback isn’t a single number to optimise. It’s a composite of three inputs, each of which tells a different part of the story.
CAC itself. Most founders understate their CAC by 30–40% by excluding fully-loaded costs. It isn’t just ad spend. It includes sales team salaries and commissions, marketing headcount, tools, conferences, and any professional services involved in closing deals. When an investor’s analyst audits your numbers during due diligence, they will find the gap. Better to close it yourself first.
Gross margin. The formula penalises lower-margin businesses because the economics of recovery are genuinely slower. A SaaS business at 80% gross margin looks completely different to a marketplace at 40%. Know your number precisely, and understand how it compares to your sector benchmark.
ARPU trend. A growing ARPU compresses payback over time without any additional acquisition spend. If your customers expand through upsell or seat growth, your effective recovery accelerates. This is one of the most powerful and most overlooked levers in the model.
The Trap That Catches Growing Companies
There’s a scenario that plays out more often than most founders want to acknowledge.
Growth is strong. Revenue is climbing. The team is energised and the pipeline looks healthy. Then due diligence starts, and the investors pull apart unit economics by cohort, not in aggregate. What they find is that while the blended CAC payback looks acceptable, the most recent customer cohorts are taking significantly longer to recover. The easy acquisition channels are saturated. Each incremental customer now costs more to win.
This is payback period creep. And it’s one of the most common reasons companies that look healthy on the surface fail to close rounds they expected to be straightforward.
According to Meritech Capital’s data, there was a sharp increase in average payback periods in 2022 as interest rates rose and buyers cut spending. Payback periods have been stabilising but have not returned to the lows seen in 2021. The macro environment has permanently raised the bar on what investors expect.
Investor tip: Always present your CAC payback by cohort, not just as a blended average. Showing that your most recent cohorts perform as well as or better than earlier ones is one of the strongest signals of a scalable go-to-market engine.
What Good Actually Looks Like — By Stage
Context matters enormously. A 20-month payback on a £75k ACV enterprise deal with 140% net revenue retention is a fundamentally different business to a 20-month payback on a £2k SMB deal with 95% retention. The benchmark isn’t a fixed number. It’s relative to your model, your sector, and your customer size.
Under 6 months: Exceptional. You have a capital-efficient growth engine and significant fundraising leverage.
6–12 months: Strong. This is where well-run early-stage companies tend to sit, and it makes for a compelling Series A story.
12–18 months: Acceptable. Workable, but be ready to explain the trajectory and show cohort-level data.
18–24 months: You will face scrutiny. Have a clear plan for how this improves, and know your NRR inside out.
Beyond 24 months: Difficult to fundraise against unless ACV, NRR, or sector norms explicitly justify it.

Three Levers to Improve Your Position
Reduce CAC through channel efficiency. Audit every acquisition channel by payback period, not just by volume or cost per lead. A channel delivering 200 customers at 24-month payback is worse than one delivering 50 customers at 8 months. Invest in organic, referral, and product-led growth. These consistently carry the shortest payback periods and the strongest unit economics.
Improve gross margin. Review your cost of goods sold line by line. Hosting costs, third-party tools bundled into your service delivery, professional services hours that could be productised: every percentage point of margin improvement shortens payback without touching acquisition at all.
Drive retention and expansion revenue. CAC payback is calculated on initial ARPU, but your actual recovery accelerates if customers expand. A customer who upgrades at month four pays back their acquisition cost faster than the model predicts. Upsell, cross-sell, and seat expansion are among the highest-leverage moves available to any founder managing unit economics.
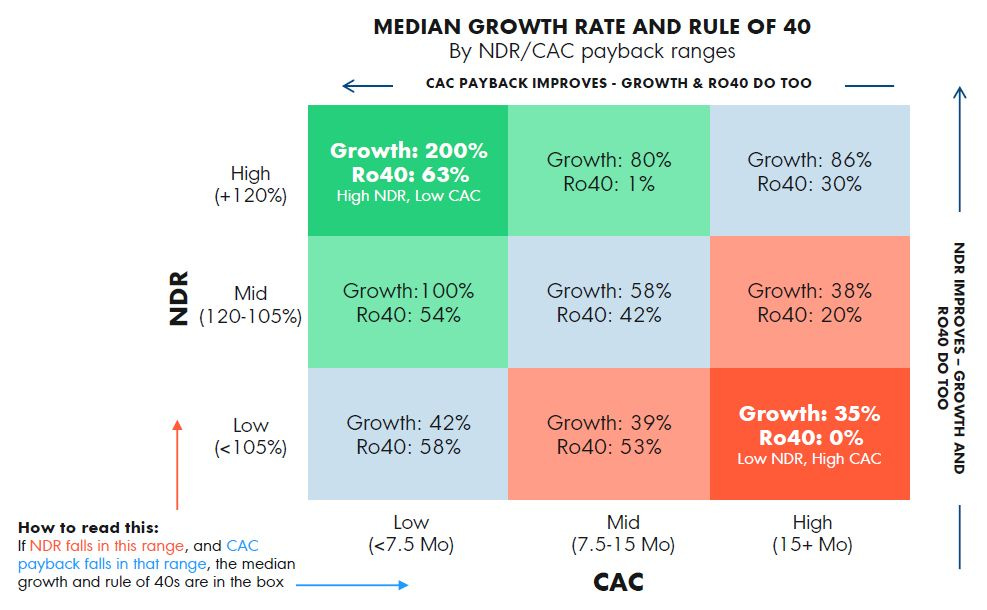
OpenView’s research makes this explicit: companies with great NDR and CAC payback have median growth rates of 200% and follow the Rule of 40 at 63% median. Companies that struggle on both metrics average 35% growth and a Rule of 40 of 0%. The two metrics are not independent. They compound.
Knowing Your Number Before the Room Does
The founders who walk into fundraising conversations with complete command of their unit economics don’t just close deals faster. They close better deals, on better terms, with more informed partners, and with less dilution on the table.
CAC payback is the clearest expression of how efficiently a business turns capital into growth. Own it by cohort, by channel, by customer segment. Be able to answer the follow-up questions without referring to your deck.
Because the room doesn’t go quiet when your number is bad.
The room goes quiet when you don’t know your number.
Know Before They Ask
Most founders get asked this question and freeze. Don’t be that founder.
The CAC Payback Calculator is part of The Founders Corner resource library, built specifically for founders who are fundraising, preparing to, or just want to know where they actually stand.
Drop in your numbers and get instant clarity on:
Your CAC payback period, colour-coded against investor benchmarks
Customer LTV and LTV:CAC ratio
Monthly gross profit per customer
A plain-English verdict on whether your unit economics are fundable right now
And the calculator is just the start. Subscribers get access to 50+ founder tools, templates, and deep-dive resources inside The Founders Corner library, with new ones added every week.
Download the CAC Payback Calculator
Keep reading with a 7-day free trial
Subscribe to The Founders Corner® to keep reading this post and get 7 days of free access to the full post archives.