
⚡ The $100M Slide: How Founders Nail TAM, SAM & SOM
How to turn your market sizing from guesswork into a growth story investors trust.

👋 Hey, Chris here! Welcome to BrainDumps—a weekly series from The Founders Corner. If you’ve been reading along, you know this series is a preview of a bigger project. Well, it’s finally here: The Big Book of BrainDumps is out now!
It isn’t a theory book—it’s the founder’s field manual. Inside, you’ll find 70 powerful frameworks distilled from 30+ years scaling software companies to hundreds of millions in ARR, 20+ years investing in 500+ B2B tech startups, and over $1B of shareholder value created. From raising capital to hiring your first VP of Sales, this book turns scars and successes into practical playbooks you’ll return to again and again. I expect most copies will become well-worn, scribbled on, and dog-eared—because it works.

Table of Contents
Why Market Sizing Matters So Much
Step One: TAM — The Total Addressable Market
Step Two: SAM — The Serviceable Addressable Market
Step Three: SOM — The Serviceable Obtainable Market
How to Present TAM, SAM, and SOM in Your Deck
Strategic Benefits Beyond Fundraising
The Pitfalls to Avoid
The Investor’s Perspective
Putting It All Together
The Bigger Picture
You’ve built your pitch deck. The story flows. You’ve nailed your problem-solution narrative and shown why now is the right time. But then comes the slide that causes more tension in investor meetings than any other: the market size slide.

Every founder knows it’s important. Every investor expects to see it. Yet, it’s astonishing how often this single slide derails an otherwise great pitch.
The issue isn’t that founders can’t do the maths. It’s that they misunderstand what the numbers mean.
This is where Sequoia’s structure leaves off — and where we turn to one of the most misunderstood but crucial concepts in your deck: TAM, SAM, and SOM.
Why Market Sizing Matters So Much
Market sizing isn’t just an academic exercise — it’s a signal of how well you understand your business and the space you’re playing in.
When an investor looks at your market slide, they’re not just thinking, “How big is this?” They’re asking:
Does this founder understand where they can win first?
Are their numbers grounded in logic or wishful thinking?
Is this a focused wedge into a large opportunity, or a vague stab at a trillion-dollar dream?
Done well, your market sizing proves you’re a strategist, not a dreamer. It shows you know how to land and expand — starting small, proving value, and scaling from there.
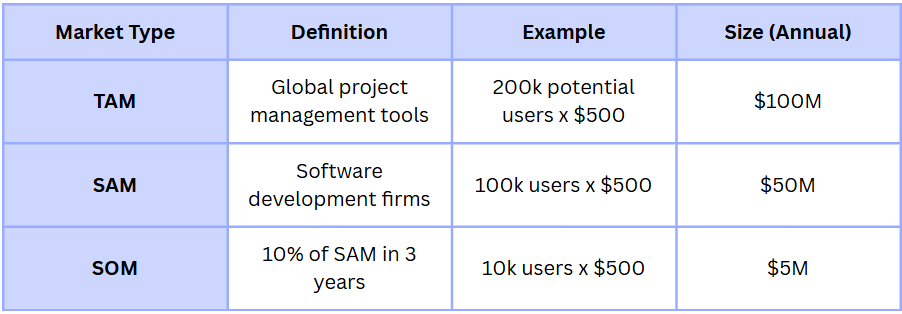
Step One: TAM — The Total Addressable Market
Definition:
TAM is the total revenue opportunity available if your product or service achieved 100% market share. It’s the “big universe” number — a way of showing the total potential value of the problem you’re solving.
Calculation:
Multiply the total number of potential customers by your average revenue per user (ARPU).
Example:
Let’s say you sell project management software at $500 per seat per year. There are 200,000 potential customers globally. Your TAM?
$500 × 200,000 = $100 million annually.
That’s your ceiling — the total theoretical opportunity if everyone bought from you.
Use:
TAM helps investors see the scale of your ambition. It’s useful for setting long-term direction, but it’s not the number you’ll build your forecast around.
The Common Mistake:
Founders often inflate their TAM because they think bigger is always better. It’s not. A huge TAM with no clear entry point looks naïve. A credible TAM with logical segmentation looks smart.
Investors don’t fund potential energy; they fund founders who know how to convert it into kinetic energy.
Step Two: SAM — The Serviceable Addressable Market
Definition:
SAM refines your TAM to include only the portion of the market that’s actually reachable with your product and business model today.
Calculation:
Take your TAM and apply filters — geography, customer segment, language, or regulatory reach.
Example:
If your project management software is designed specifically for software development teams, and there are 100,000 such firms globally, then:
$500 × 100,000 = $50 million.
That’s your SAM — the segment of the market that aligns with your current capabilities.
Use:
SAM helps you focus. It identifies where you can compete effectively and direct your marketing, sales, and product efforts.
The Investor View:
When VCs look at your SAM, they’re asking: “Can this team win here?”
A crisp, focused SAM slide communicates strategic maturity. It shows you know your ideal customer and your go-to-market boundaries. It also signals that your growth will come from depth first, breadth later.
Step Three: SOM — The Serviceable Obtainable Market
Definition:
SOM is your realistic first target — the part of your SAM you can actually capture given your resources, stage, and competition.
Calculation:
Estimate the percentage of SAM you can realistically acquire in the next few years, based on your current traction, team, and GTM motion.
Example:
If you believe you can capture 10% of your $50 million SAM within three years, your SOM is:
$5 million in annual recurring revenue.
Use:
SOM is the bridge between ambition and execution. It sets your short-term revenue goals and validates your early market assumptions.
Why It Matters:
When investors see a well-reasoned SOM, they don’t just see a number — they see a founder who’s grounded, realistic, and execution-oriented.
SOM isn’t about dreaming. It’s about planning. It tells the investor:
“Here’s where we’ll win first, and how that unlocks everything else.”
How to Present TAM, SAM, and SOM in Your Deck
Think of your market sizing slide as a story in miniature.
You’re taking investors on a journey:
The Big Picture (TAM): “Here’s how big this market could be.”
Our Focus (SAM): “Here’s where we’re focusing first.”
Our Plan (SOM): “Here’s what we can realistically win — and how.”
A simple, three-circle Venn diagram or funnel chart works beautifully. Visual clarity builds confidence.
Then, pair your visuals with one or two lines of logic. For example:
“We’re starting in the UK SMB construction market — $250M SAM — and expect to capture 5% within 24 months through direct sales and channel partners.”
That single sentence shows scale, focus, and a plan.
Strategic Benefits Beyond Fundraising
TAM, SAM, and SOM aren’t just for your pitch deck. Used properly, they become powerful strategic tools for running your business.
Product Strategy: Align your roadmap with your SAM. Build features that serve your core, reachable market before chasing adjacent segments.
Marketing: Focus your campaigns where your SOM is richest. Don’t spread yourself thin.
Sales: Use SOM to set realistic revenue targets and territory plans.
Investor Relations: Revisit your TAM/SAM/SOM every 6–12 months to reflect traction and market shifts. It keeps your narrative fresh and your investors confident.
The Pitfalls to Avoid
Let’s be honest: market sizing is where many decks lose credibility. Here are the classic mistakes that make investors tune out:
The $1 Trillion Market Fallacy – Claiming to play in a trillion-dollar space but failing to define your niche.
Top-Down Guesswork – Using broad stats (“10% of X industry”) without bottom-up validation.
No Segmentation – Treating all customers as equal, with no clear ICP.
No Evidence – Presenting big numbers with no supporting data, sources, or logic.
The best founders blend top-down and bottom-up analysis. They use public data for context, then validate it with first-hand insights — pilot results, customer interviews, and pipeline data.
The Investor’s Perspective
Remember, investors see hundreds of decks. When they reach your market sizing slide, they’re thinking in probabilities, not possibilities.
A great TAM excites them.
A sharp SAM reassures them.
A credible SOM convinces them.
The investor’s internal dialogue goes something like this:
“This founder understands the playing field. They’ve found a wedge that’s small enough to win, but big enough to matter.”
That’s what earns you a second meeting.
Putting It All Together
So, how do you bring it home in your deck?
A clean market sizing slide might look like this:
It’s simple, visual, and evidence-backed.
The Bigger Picture
Ultimately, TAM, SAM, and SOM aren’t just financial estimates — they’re reflections of your strategic thinking. They show whether you understand who your customer is, how to reach them, and what it takes to win.
When you can articulate that clearly, you’re no longer just pitching a product. You’re pitching a business that knows exactly where it’s going — and how big the opportunity truly is.
In the next section, we’ll take the logical next step — you’ve told your story, shown your market, and set your targets. Now it’s time to look at the pitch itself: how to handle the meeting, respond to objections, and navigate due diligence once the “yes” is on the table.
Because winning the pitch is just the beginning — the real work starts after the handshake.
—Chris Tottman
Whether you're funded or bootstrapped, these are numbers and concepts it pays to know!
the "strategist vs dreamer" distinction is everything chris. most founders think bigger tam = better pitch. wrong. investors fund wedges, not wishes. the som is where you prove execution ability. a tight $5m som with clear path beats a vague $500m sam every time. the mistake is conflating market potential with market access. nail where you win first, expansion comes later 💯