
🤫 Here's Google's Secret Framework for Building Products That Users Love
Measure and improve user experience like Google, with their hidden "HEART" playbook.

👋 Hey, Chris here! Welcome to BrainDumps—a weekly series from The Founders Corner. If you’ve been reading along, you know this series is a preview of a bigger project. Well, it’s finally here: The Big Book of BrainDumps is out now!
It isn’t a theory book—it’s the founder’s field manual. Inside, you’ll find 70 powerful frameworks distilled from 30+ years scaling software companies to hundreds of millions in ARR, 20+ years investing in 500+ B2B tech startups, and over $1B of shareholder value created. From raising capital to hiring your first VP of Sales, this book turns scars and successes into practical playbooks you’ll return to again and again. I expect most copies will become well-worn, scribbled on, and dog-eared—because it works.

Table of Contents
The Big Lie About Product Success
What Is the HEART Framework?
Why HEART Beats Vanity Metrics
❤️ 1. Happiness: What Do Users Feel?
📈 2. Engagement: Are Users Actually Using It?
🧭 3. Adoption: Are New Users Reaching Value?
🔁 4. Retention: Are Users Sticking Around?
✅ 5. Task Success: Can Users Do What They Came to Do?
Bonus: Using HEART Across the SaaS Journey
Ask These Questions as You Apply HEART
Final Thoughts: Why HEART Belongs in Every Founder’s Toolkit

The Big Lie About Product Success
Most founders I meet are obsessed with traction. And fair enough—it’s how you raise money, how you get noticed, and how you measure momentum.
But here’s the trap: many chase growth without understanding what keeps users coming back.
They build features, run ads, and push hard on outbound—but they never stop to ask:
“What’s it like to be a user of this product, day in and day out?”
That’s where Google’s HEART framework comes in. It’s one of the most quietly powerful tools for SaaS founders—because it focuses not just on what your users do, but how they feel, why they stay, and where they struggle.
This BrainDump is your guide to applying HEART in the real world—from MVP to scale.
What Is the HEART Framework?
HEART stands for:
Happiness
Engagement
Adoption
Retention
Task Success
It was developed by Google’s UX team to bridge the gap between analytics and empathy—to quantify the quality of user experience in ways that actually help teams build better products.
Unlike dashboards that drown you in page views and MAUs, HEART offers five lenses that focus you on what matters: user satisfaction, product stickiness, and feature usability.
The best bit? It works at every stage—from MVP to Series C.
Why HEART Beats Vanity Metrics
I’ve worked with SaaS founders who hit 100,000 users but couldn’t tell me:
Why people loved their product
Which features drove retention
Or where new users got stuck
Without that insight, you're flying blind.
HEART gives you a way to:
Benchmark how your product feels to use
Track early signs of churn
Prioritise UX fixes that move the needle
Align product, design, and growth around the same goals
Let’s break it down, piece by piece.
❤️ 1. Happiness: What Do Users Feel?
Happiness is the emotional signal. It’s how users feel when they interact with your product. Not just “did it work?”—but “do I enjoy using it?”
Metrics:
Net Promoter Score (NPS)
Customer Satisfaction Score (CSAT)
Feature satisfaction surveys
In-app feedback (thumbs up/down, quick polls)
Founder Playbook:
Trigger an NPS survey 7–14 days after signup
Run CSAT after key flows (e.g., after uploading a file, creating a report)
Ask: “What’s one thing we could improve?” in the exit modal
One B2B founder used a single post-onboarding CSAT prompt to uncover friction in team invites. Fixing it improved activation by 18%.
Happiness drives referrals. It builds brand. And it tells you whether your product is delivering emotional value—not just functional output.
📈 2. Engagement: Are Users Actually Using It?
Engagement is about frequency and depth of use. Are users logging in regularly? Are they sticking with the core experience?
This is a direct proxy for your product’s value in daily life.
Metrics:
Daily/Weekly Active Users (DAU/WAU)
Session length
Feature usage frequency
Click paths to value moments
Founder Playbook:
Define your product’s “core loop” (e.g., in Slack: sending messages)
Track usage of that loop over time
Create engagement cohorts based on feature usage
One analytics startup noticed most users dropped off after uploading a dataset. Engagement metrics revealed the issue: their visualisations took too long to load. A simple caching fix doubled session length and DAU.
Another founder in edtech noticed learners weren’t engaging with key lessons. Why? Engagement data showed they didn’t know where to start. A single UI tweak (adding “Start Here” flags) lifted usage 30%.
Engagement isn’t about “time on site.” It’s about time well spent.
🧭 3. Adoption: Are New Users Reaching Value?
Adoption measures how many new users are converting from “curious” to “active.” It’s your first impression in action.
This is critical in SaaS, where onboarding is often where users decide: is this worth learning?
Metrics:
% of signups who complete onboarding
Time to first meaningful action (TTFMA)
New feature opt-in rate
Trial-to-paid conversion
Founder Playbook:
Set a clear definition of activation (e.g., “created first report”)
Measure how many users reach that within 7 days
Survey drop-offs with: “What stopped you from completing setup?”
One founder reduced onboarding steps from 8 to 3—and adoption jumped 40%. Another added in-app nudges to help users complete setup. Engagement tripled.
Don’t just ask “did they sign up?” Ask: Did they get value? Adoption is the fastest way to validate product-market fit.
🔁 4. Retention: Are Users Sticking Around?
Retention is the most telling metric in SaaS. If users leave, you lose.
If you don’t measure and improve retention early, nothing else matters. Ads won’t save you. New features won’t save you.
Metrics:
Retention at 7, 30, 60, 90 days
Churn rate (voluntary and involuntary)
Expansion revenue (upsells, upgrades)
Founder Playbook:
Track weekly retention cohorts
Trigger feedback requests at 30 days
Identify your “retention features”—what actions correlate with stickiness?
A fintech founder noticed 90-day churn was high. Retention data showed users who connected 3+ bank accounts were 4x more likely to stay. So they redesigned onboarding to encourage that—and churn dropped 28%.
Retention is where long-term value lives. It’s also where your biggest problems (and opportunities) are hiding.
✅ 5. Task Success: Can Users Do What They Came to Do?
Task Success is about usability. Can users complete the job they came to your product for? Easily, quickly, and without error?
If Happiness is emotional, and Engagement is behavioural, Task Success is functional.
Metrics:
Task completion rate
Time on task
Error rate / failure rate
Founder Playbook:
Identify the 3 most critical flows (e.g., create project, export data)
Track how many users complete those tasks—and how long it takes
Watch screen recordings of drop-offs (e.g., via FullStory)
A productivity app founder discovered users failed to assign tasks because the button was hidden behind a dropdown. A simple redesign (moving it front and centre) increased task completion 2x.
If users can’t complete tasks, they won’t stick around. Task Success gives you the clearest roadmap for UX wins.
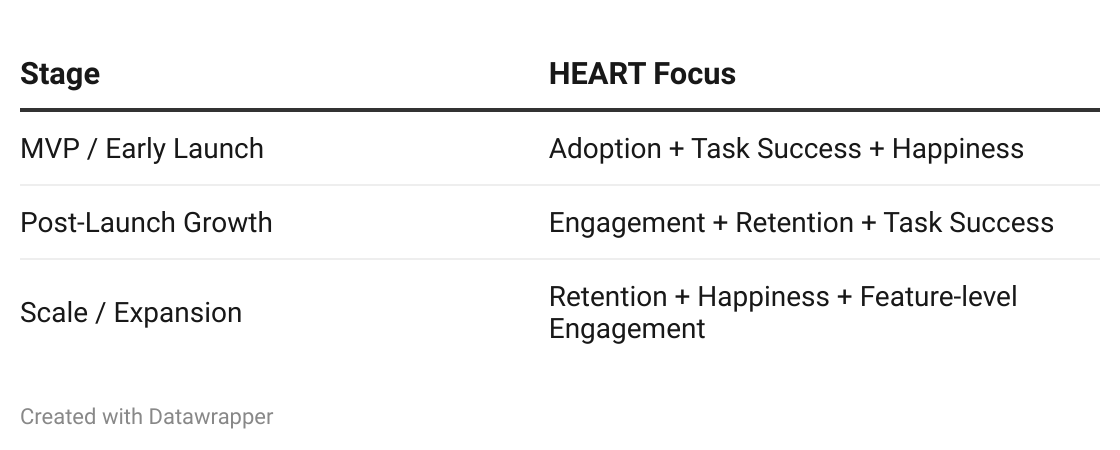
Bonus: Using HEART Across the SaaS Journey
HEART isn’t just a measurement tool—it’s a strategy compass.
Here’s how I recommend using it across key phases of startup growth:
Example 1: Post-MVP
You’ve launched to 100 users. Only 30 reach “first value.” That’s an Adoption issue.
→ Simplify onboarding. Add prompts. Move value upfront.
Example 2: Mid-Growth
DAU is rising, but 60-day retention is falling. That’s a Retention issue.
→ Look at which features correlate with stickiness. Double down. Build education around them.
Example 3: Scaling a New Feature
You shipped reporting. Usage is low. That’s a Task Success + Engagement issue.
→ Check if users can find it, use it, and understand it. A/B test the flow.
Ask These Questions as You Apply HEART
Each HEART metric comes with powerful questions that cut through noise:
For Happiness
What do users love—and why?
What annoys them?
Would they recommend us? Why or why not?
For Engagement
Are users coming back? What brings them back?
What features get used most?
What features are ignored?
For Adoption
What’s stopping new users from succeeding?
Where do they drop off?
How long does it take to get to value?
For Retention
Why are users leaving?
What’s different about the ones who stay?
How can we reward longevity?
For Task Success
Can users complete core jobs easily?
What’s confusing or slow?
Where are they making mistakes?
These questions transform metrics into actionable priorities.
Final Thoughts: Why HEART Belongs in Every Founder’s Toolkit
We spend so much time obsessing over revenue, leads, and ARR. And yes—they matter. But what really moves the needle is building something that users love using.
That’s where HEART shines. It connects data to empathy. It makes UX measurable. And it gives every team—from design to growth to customer success—a shared language for making things better.
I’ve watched founders save failing features, revive onboarding, and double retention just by tracking the right HEART metric and listening carefully.
So here’s my challenge to you:
Pick one HEART metric and improve it in the next 30 days.
Not five. Just one.
Watch what happens.
Because when you build a product users can’t imagine living without, growth takes care of itself.
Build with HEART. Scale with confidence.
—Chris Tottman
Great piece Chris!